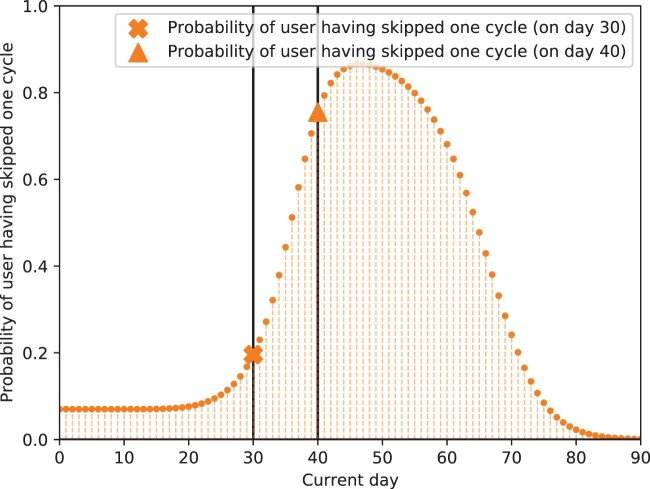
Figure 3.
Predicted probability of skipping 1 cycle over time for a simulated user. Orange curve represents probability of user having skipped 1 cycle; markers indicate probability of having skipped 1 cycle on day 30 or 40 of the upcoming cycle. We see that the probability of having skipped 1 cycle in the upcoming cycle is low until day 30. However, past day 30, we see that this probability increases; on day 40, it is around 0.8 (vs 0.2 on day 30). Thus, the model detects that the user is likely to have skipped a cycle on day 40, when their typical cycle length has been passed. Because data in this experiment are simulated, we know that this user has skipped a cycle before in their history and does actually skip the next cycle. Our inferred probabilities recover this, showing that our model can accurately detect when a user is likely to have skipped an upcoming cycle based on their individual cycle length histories and update these beliefs over time.

