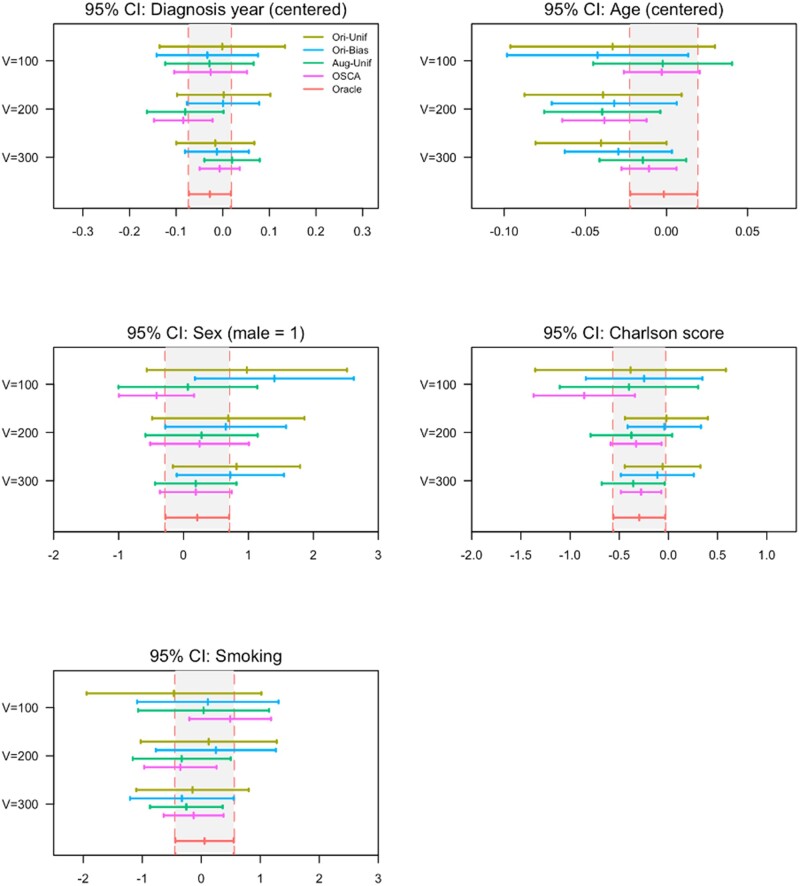
Figure 6.
Point estimates and 95% confidence intervals (CI) for the association (on log odds ratio scale) between cancer recurrence and risk factors in the KPW colon cancer cohort. The validation sample size was varied across values of 100, 200, or 300. The gray bands bounded by vertical red dashed lines represent the 95% CI of the association based on the gold standard status (red line) determined for the full sample (N = 1063). The dark yellow line represents the Ori-Unif method, the blue line represents the Ori-Bias method, the green line denotes the Aug-Unif method, and the pink line denotes the proposed OSCA method. Aug-Unif: augmented uniform sampling method; KPW: Kaiser Permanente Washington; Ori-Bias: original biased sampling method; Ori-Unif: original uniform sampling method.

