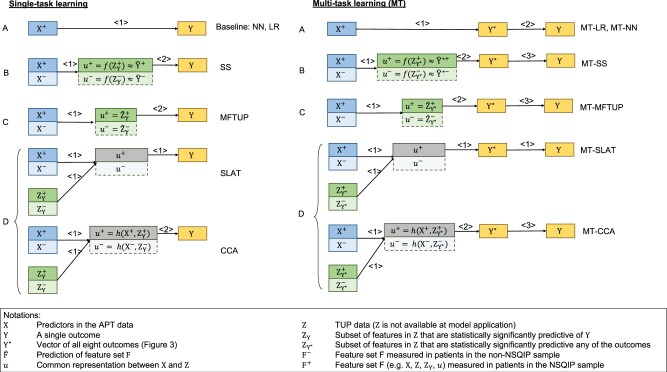
Figure 2.
Overview of proposed models. X represents features (predictors) in the APT data, Z in the TUP data, and Y represents a single outcome, while Y* represents the vector of all 8 outcomes. Arrows signal predictive relationships and the numbers above the arrows denote the order in which the predictions are made. When multiple numbers coincide (eg, SLAT), the corresponding predictions are made at the same time. Modeling approaches can be classified into 4 categories, denoted by the different capital letters, according to the intermediate features they build. Approach A does not construct any intermediate features. Instead, it models Y directly without Z (these are the baseline models). Approach B uses the estimates of (the probability of) Y as intermediate features. Approach C uses Z or a subset of Z as the intermediate feature to model Y. Finally, Approach D constructs a shared hidden layer from X and Z as the intermediate feature. The colors correspond to Figure 1, and gray represents the intermediate features. Saturated colors denote the NSQIP sample (samples with the adjudicated outcome labels), and the less saturated colors denote the non-NSQIP sample (with missing outcome labels). Positive superscripts denote the NSQIP sample, negative superscripts denote the non-NSQIP samples (missing labels), and the absence of a superscript denotes the entire dataset. APT: available at prediction time; SLAT: Shared LATent layer; TUP: temporally unavailable at prediction time.

