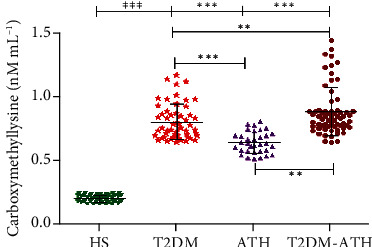
Figure 12.

Carboxymethyllysine concentration (nM mL−1) in the sera of healthy subjects (HS, n = 50) and diabetic (T2DM, n = 54), atherosclerosis (ATH, n = 33), and diabetic atherosclerosis (T2DM-ATH, n = 65) patients. The HS group was used as a control. All the three patient groups showed statistical significance with respect to the HS group and among themselves (∗p < 0.05, ∗∗p < 0.001, and ∗∗∗p < 0.0001). Data are presented as mean ± SD of three independent experiments.
