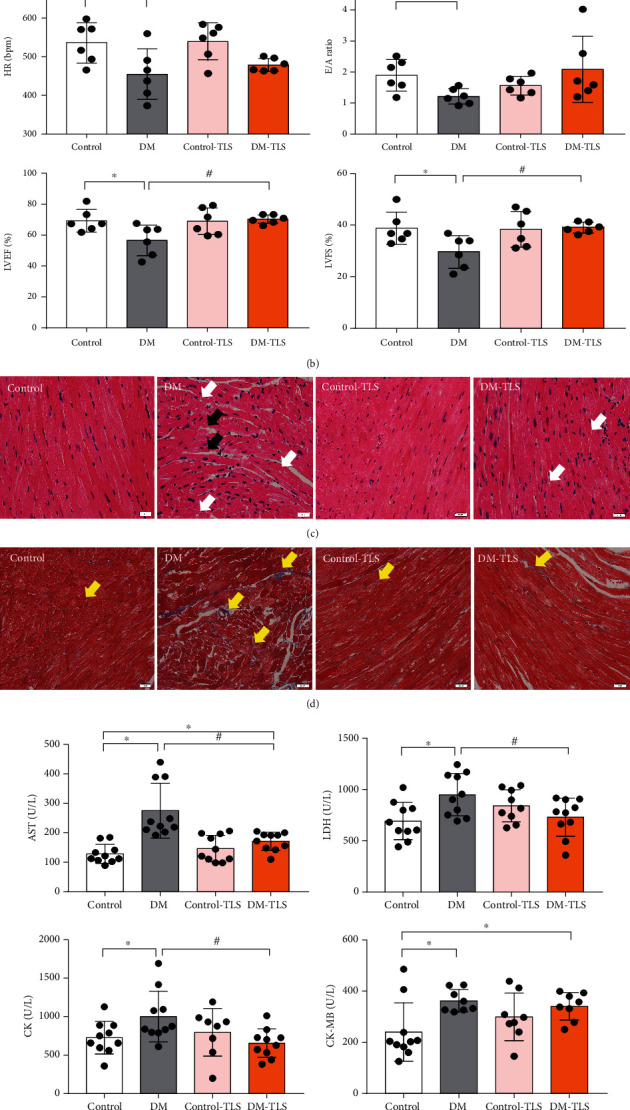
Figure 2.

TLS changes the cardiac function and structure in diabetic mice. (a) Representative echocardiography image. (b) Quantification of echocardiography (n = 6 per group). (c) Representative image of HE staining (n = 5 per group). (d) Representative image of Masson trichromatic staining (n = 5 per group). (e) Quantification of serum myocardial zymograms. (f) Quantification of blood lipid. n = 8-10 per group. The black arrows indicate myocardial rupture, white arrows indicate myocardial vacuole, and yellow arrows indicate myocardial collagen deposition. Means ± SD. ∗P < 0.05 compared to the control group, #P < 0.05 compared to the DM group.
