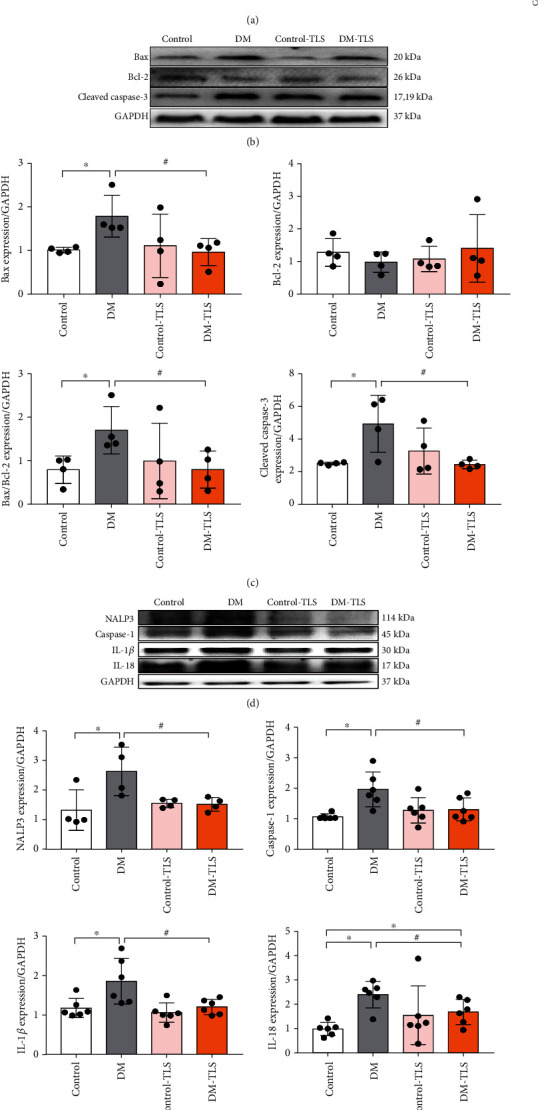
Figure 3.

TLS reduces cardiac apoptosis and pyroptosis in diabetic mice. (a) Representative image of TUNEL staining and analysis of positive cells. n = 3 per group. (b) Representative protein expression of Bax, Bcl-2, and cleaved caspase-3. (c) Quantification of Bax, Bcl-2, and cleaved caspase-3 protein expression. (d) Representative protein expression of NALP3, caspase-1, IL-1β, and IL-18. (e) Quantification of NALP3, caspase-1, IL-1β, and IL-18 protein expression. n = 4-6 per group. The values are presented as the means ± SD. ∗P < 0.05 compared to the control group, #P < 0.05 compared to the DM group.
