
Figure 7.
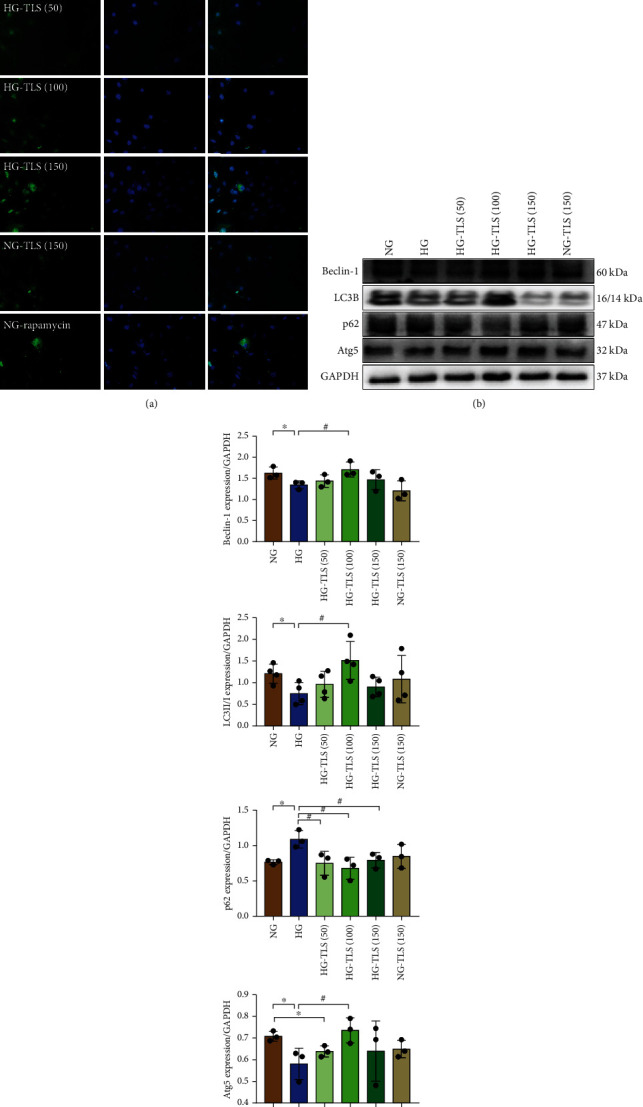
TLS activates autophagy in HG-treated cardiomyocytes. (a) Representative images of GFP-LC3B. (b) Representative protein expression of Beclin-1, LC3B, p62, and Atg5. (c) Quantification of Beclin-1, LC3B, p62, and Atg5 protein expression. GAPDH served as the loading control. Means ± SD, n = 3-4 cultures per group. ∗P < 0.05 compared to the NG group, #P < 0.05 compared to the HG group.