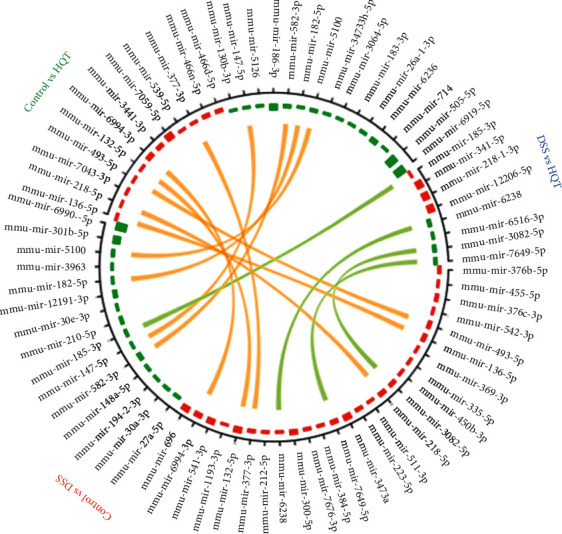
Figure 2.

Differential miRNA gene between groups. Range from the outer ring to the inner ring: differential gene names (if the genes are too many, they would not be displayed). The gene express abundance difference: red represents upregulation and green represents downregulation. The connecting lines represent the common differential genes between the two differential analyses.
