
Figure 3.
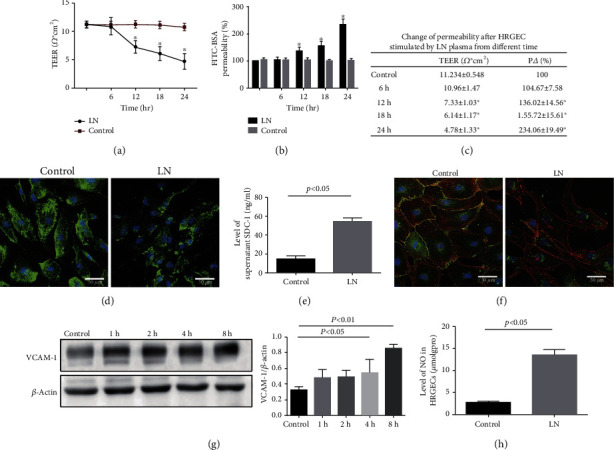
HRGEC injury contributed to the upregulation of glomerular filtration membrane permeability in LN. (a) TEER of HRGECs stimulated by LN plasma at different time was measured (n = 5). (b) HRGEC glomerular filtration membrane permeability was assessed by the FITC-BSA method (n = 5). (c) Change in TEER and glomerular filtration membrane permeability of HRGEC. (d) IF staining showing the expression of SDC-1 (green) in HRGECs. (e) The level of SDC-1 in supernatant was measured by ELISA (n = 5). (f) Colocalization of VE-cadherin (green) and F-actin (red) in HRGECs was determined by IF staining. (g) Western blotting of VCAM-1 in LN plasma-stimulated HRGECs. (h) The level of NO in HRGECs was measured (n = 5). p < 0.05 vs. control group. TEER: transendothelial electrical resistance.