Fig. 2.
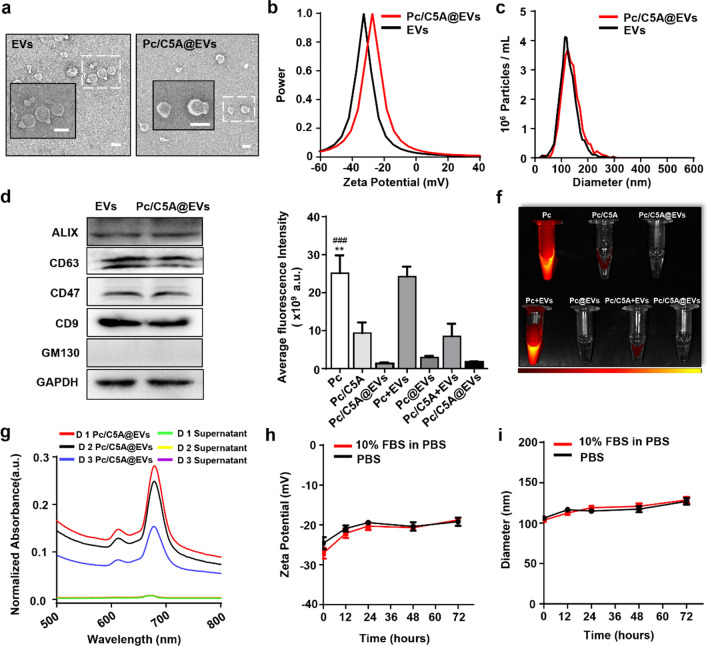
Characterization of the Pc/C5A@EV coassembly. a Representative TEM micrographs for EVs and Pc/C5A@EVs. Scale bar, 200 nm. b Zeta potential detection of EVs (black) and Pc/C5A@EVs (red). c Measurement of the size distribution of EVs (black) and Pc/C5A@EVs (red) by NTA. d Western blot analysis of GM130 and EV-specific biomarkers in EVs and Pc/C5A@EVs. e Quantitative fluorescence intensity analysis of the images in f (n = 5; ** P < 0.01 compared with Pc/C5A; ### P < 0.05 compared with Pc/C5A@EVs). f Fluorescence images of free Pc (10 µM), Pc/C5A (10 and 20 µM, respectively), Pc/C5A@EVs (10 and 20 µM of Pc and C5A, respectively; MSC-EVs, 100 µg), Pc + EVs (10 µM of Pc mixed with 100 µg of MSC-EVs without ultracentrifugation), and Pc/C5A + EVs (10 and 20 µM of Pc and C5A, respectively, and mixed with 100 µg of MSC-EVs without ultracentrifugation) in serum. g The stability of Pc/C5A@EVs in PBS at various time points measured by UV–Vis spectrometry. h, i The zeta potential and mean size changes of Pc/C5A@EVs incubated in PBS and PBS with 10% FBS for 72 h (n = 5)

