Fig. 3.
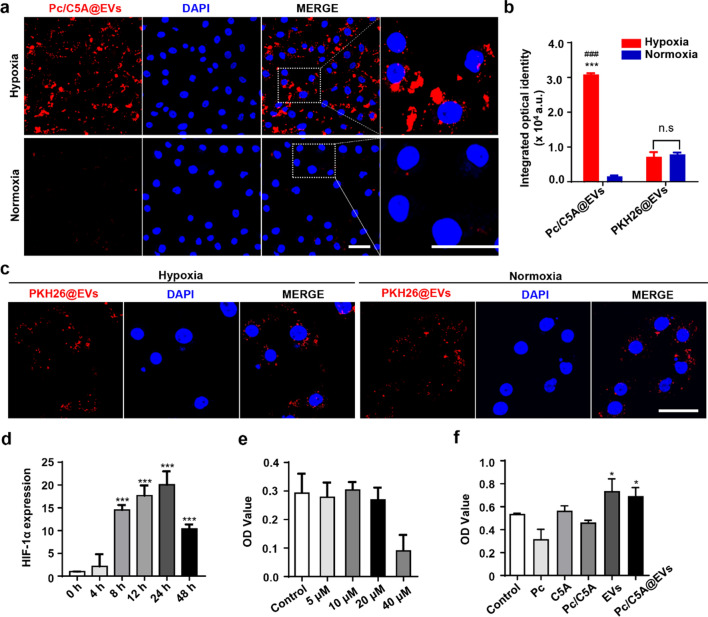
Hypoxia-sensitive imaging of TECs via Pc/C5A@EVs in vitro. a Representative CLSM images of TECs incubated with Pc/C5A@EVs under hypoxia or normoxia. Pc/C5A@EVs: red; DAPI: blue. Scale bars = 50 µm. b Quantitation of the CLSM micrographs (n = 5; *** P < 0.01 compared with Pc/C5A@EVs under normoxia; ### P < 0.01 compared with PKH26@EVs under hypoxia; n.s, not significant). c Representative CLSM images of TECs incubated with PKH26@EVs under hypoxia or normoxia. PKH26@EVs: red; DAPI: blue. Scale bars = 50 µm. d RT-qPCR analysis of the HIF-1α mRNA expression in TECs incubated in a hypoxic environment (n = 5; *** P < 0.01 compared with 0 h. e MTT cell viability assay assessing cell toxicity of C5A at concentrations ranging from 5 µM to 40 µM. f MTT cell viability assay assessing the cell toxicity following treatment with Pc, 10 µM; C5A, 20 µM; Pc/C5A, 10 and 20 µM, respectively; MSC-EVs, 100 µg; and Pc/C5A@EVs, Pc/C5A, 10 and 20 µM, respectively; MSC-EVs, 100 µg. n = 5; * P < 0.05 compared with control

