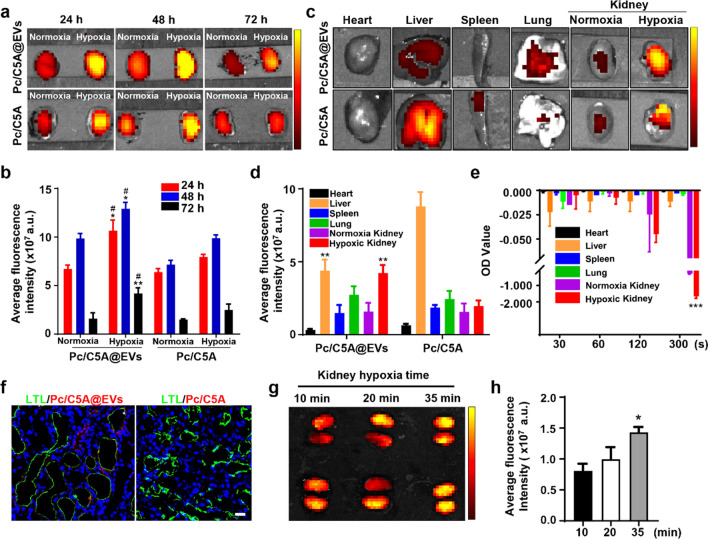
Fig. 5.
In vivo imaging of kidney hypoxia via Pc/C5A@EVs. a Ex vivo images of normoxic and hypoxic kidneys at designated time points after intravenous injection of Pc/C5A@EVs or Pc/C5A in mice with unilateral hypoxic renal injury. b Time-dependent fluorescence intensity changes in normoxic and hypoxic kidneys after Pc/C5A@EV or Pc/C5A injection (n = 5; *P < 0.05 compared with Pc/C5A@EV-treated normoxic kidneys; **P < 0.01 compared with Pc/C5A@EV-treated normoxic kidneys; #P < 0.05 compared with Pc/C5A-treated hypoxic kidneys). c Ex vivo images of major organs in the Pc/C5A@EV or Pc/C5A group. d Fluorescence intensities in the major organs after sacrifice of the hypoxic renal injury mice on day 3 after injection (n = 5, **P < 0.01 compared with Pc/C5A). e The expression of azo reductase in different organs (n = 5, ***P < 0.01 compared with normoxia kidney). f CLSM micrographs of kidney slices from the mice injected by Pc/C5A@EVs or Pc/C5A for 24 h. LTL: green; Pc/C5A, Pc/C5A@EVs: red; DAPI: blue. Scale bars = 20 µm. g, h Fluorescence imaging of the mice at 12 h postinjection after 10-, 20-, or 35-min bilateral hypoxic renal injury

