Fig. 6.
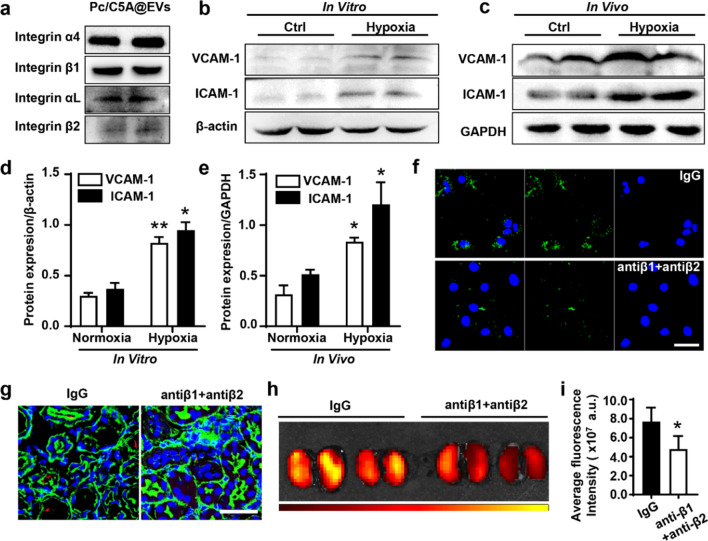
The coassembly targeted to the hypoxic kidneys via integrin receptor α4β1 and αLβ2. a Western blot of the integrin α4, αL, β1 and β2 expression in Pc/C5A@EVs. b–e Western blot of the VCAM-1 (b, d) and ICAM-1 (c, e) expression in TECs or renal tissues under hypoxia. (n = 5, *P < 0.05 compared with normoxia group; **P < 0.01 compared with normoxia group) f, g Representative CLSM images of the cellular uptake of Pc/C5A@EVs after blocking of integrin β1 and β2 in hypoxic TECs or renal tissues. Scale bars = 50 µm. h, i Fluorescence imaging and quantitative analysis of IgG- or blocking antibody-treated Pc/C5@EVs in bilateral hypoxic renal injury mice. (n = 5; *P < 0.05 compared with the IgG group)

