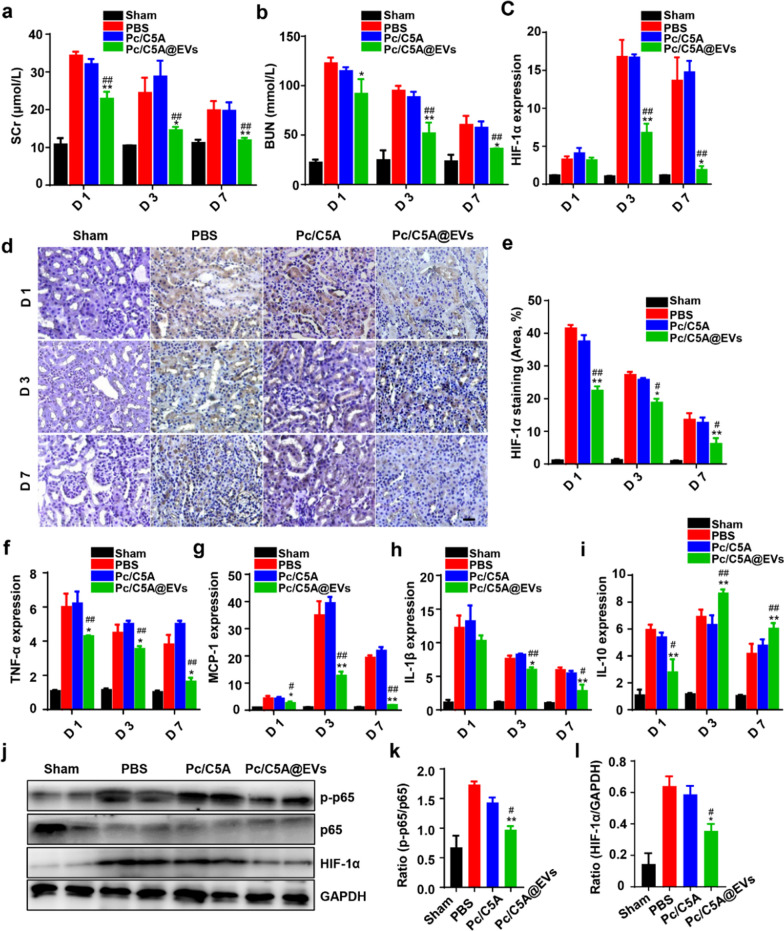
Fig. 7.
Pc/C5A@EVs downregulated the HIF-1α expression and NF-κB signaling pathway in mice with kidney hypoxia injury. a, b Measurement of SCr and BUN levels at different time points (n = 5; *P < 0.05 compared with PBS; **P < 0.01 compared with PBS; ##P < 0.01 compared with Pc/C5A). c RT-qPCR analysis of HIF-1α mRNA expression in different groups on days 1, 3, and 7 (n = 5; **P < 0.01 compared with PBS; ##P < 0.01 compared with Pc/C5A; *P < 0.05 compared with PBS. d Micrographs depicting HIF-1α immunostaining in renal tissues on days 1, 3, and 7 after injection. Scale bar = 100 µm. e HIF-1α staining quantitation in different groups (n = 5; **P < 0.01 compared with PBS; ##P < 0.01 compared with Pc/C5A; *P < 0.05 compared with PBS; #P < 0.05 compared with Pc/C5A). f–i RT-qPCR detection of TNF-α (f), MCP-1 (g), IL-1β (h) and IL-10 (i) expression in renal tissues of different groups on day 7 (n = 5; *P < 0.05 compared with PBS; **P < 0.01 compared with PBS; #P < 0.05 compared with Pc/C5A; ##P < 0.01 compared with Pc/C5A). j–l Western blot analysis of p-p65, p65 and HIF-1α expression in different groups (n = 5; **P < 0.01 compared with PBS; #P < 0.05 compared with Pc/C5A)

