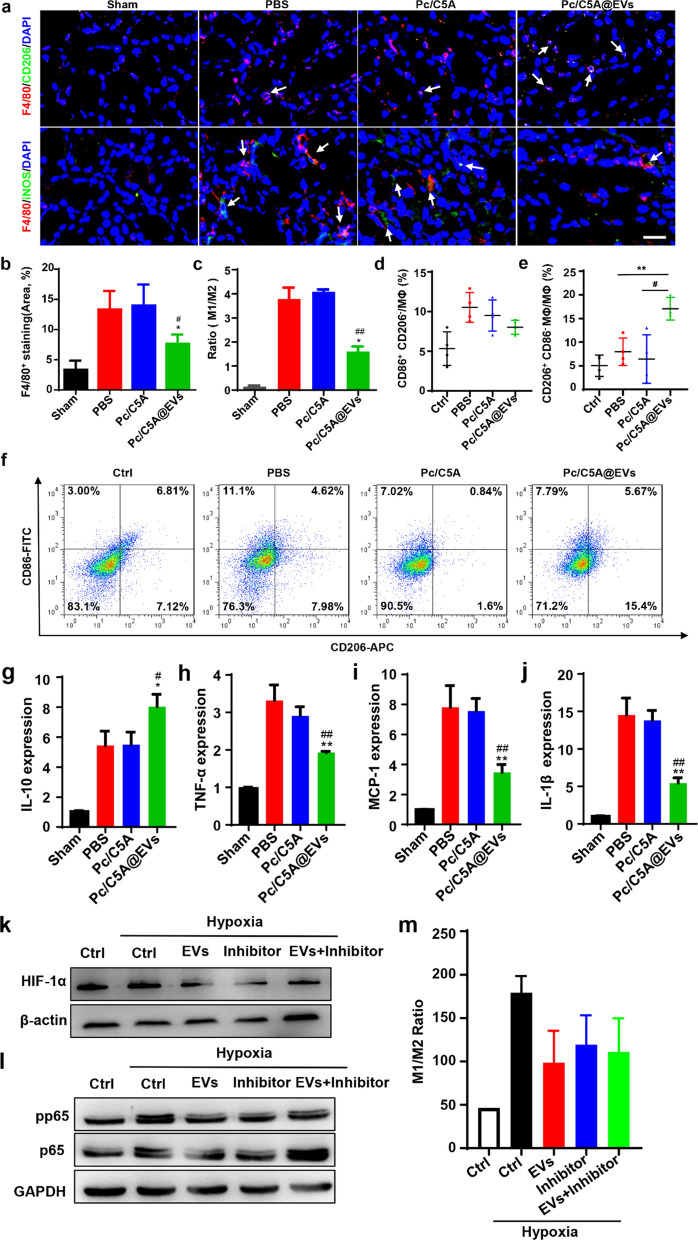
Fig. 8.
Pc/C5A@EVs induced M2 macrophage transition in hypoxic kidneys. a Immunofluorescence staining images of F4/80 (red), iNOS (green) and CD206 (green) in kidney tissues of different groups. DAPI: blue. Scale bar = 100 µm. b Quantitation of F4/80+ areas of kidney tissues. c Quantitative analysis of the M1-to-M2 ratio in kidney tissues. d–f Flow cytometry analysis showing the percentages of M1 (CD86+CD206−, (d) or M2 (CD206+CD86−, (e) Phenotypes in RAW 264.7 cells from different groups (n = 4, **P < 0.01 compared with PBS; # P < 0.05 compared with Pc/C5A). g–j The mRNA levels of anti-inflammatory gene IL-10 (g), pro-inflammatory genes TNF-α (h), MCP-1 (i) and IL-1β (j) in RAW264.7 cells from different groups (n = 3; * P < 0.05 compared with PBS; **P < 0.01 compared with PBS; #P < 0.05 compared with Pc/C5A; ##P < 0.01 compared with Pc/C5A). k HIF-1α expression in different groups detected by Western blot. l p-p65 and p65 expression in different groups detected by Western blot. m Flow cytometry analysis showing the ratio of M1 (CD86+CD206−)/M2 (CD206+CD86−) in RAW 264.7 cells from different groups

