FIG. 10.
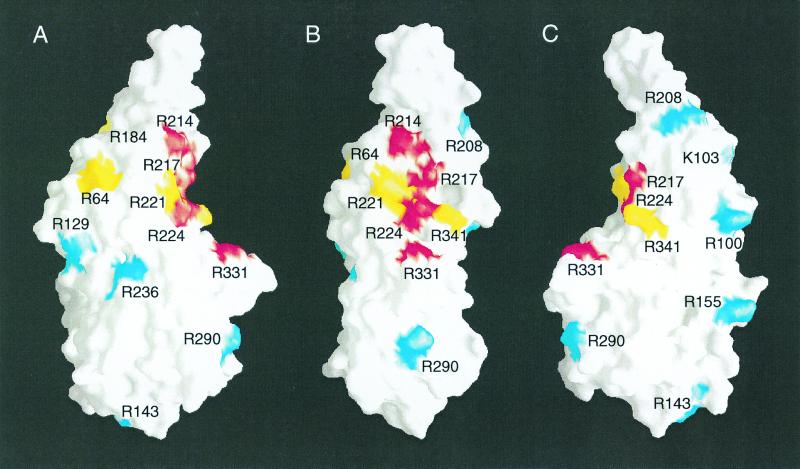
Mutations that disrupt DNA binding map to the concave surface of the structured VP16 core. A molecular surface representation (30) was used to generate three projections of the VP16 core. The surface of the VP16 core is shown in white. The surfaces of amino acids whose replacement with alanine prevents DNA binding and VP16-induced complex formation are shown in red, those whose replacement prevents DNA binding but not full VP16-induced complex formation are shown in yellow, and those whose replacement results in wild-type (WT) or nearly wild-type VP16 activity are shown in blue. A, right-side view; B, front view; C, left-side view.

