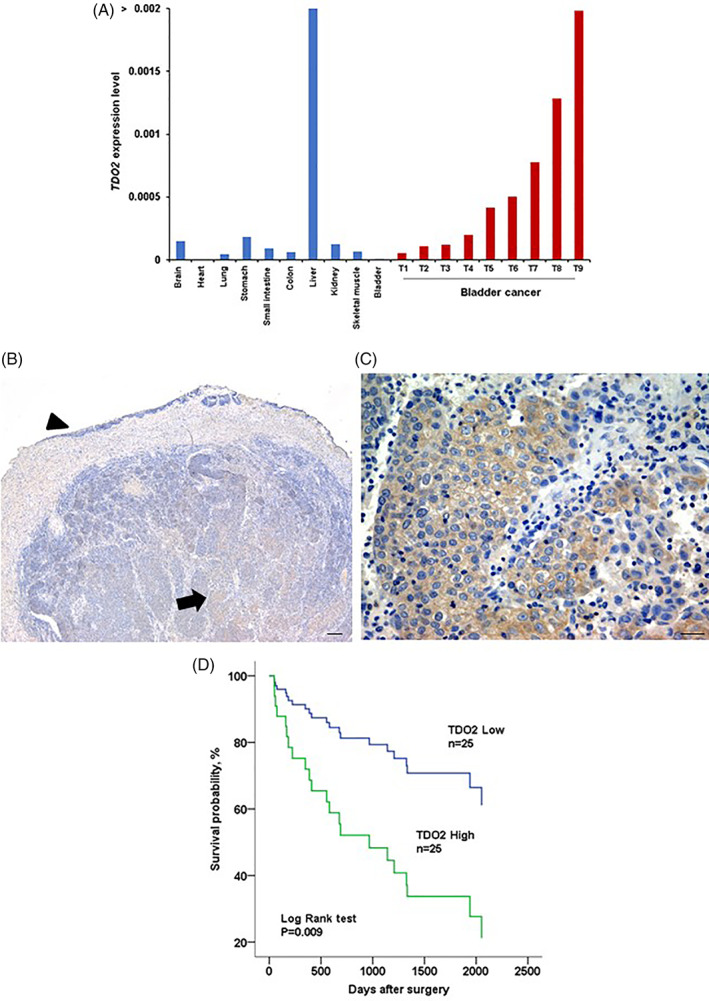
FIGURE 1.

TDO2 expression in BC tumors. (A) TDO2 expression in 10 types of normal tissue samples and 9 BC tissue samples by qRT‐PCR. (B, C) IHC staining of TDO2 in BC tumors. (B) Normal urothelium showed weak cytoplasmic staining (arrowhead); tumor cells presented strong cytoplasmic staining with TDO2 (arrow). Scale bar, 100 μm. (C) Strong cytoplasmic TDO2 staining was observed in tumor cells. Scale bar, 10 μm. (D) Survival analysis of BC patients with high and low TDO2 expression by Kaplan–Meier method
