Fig. 1.
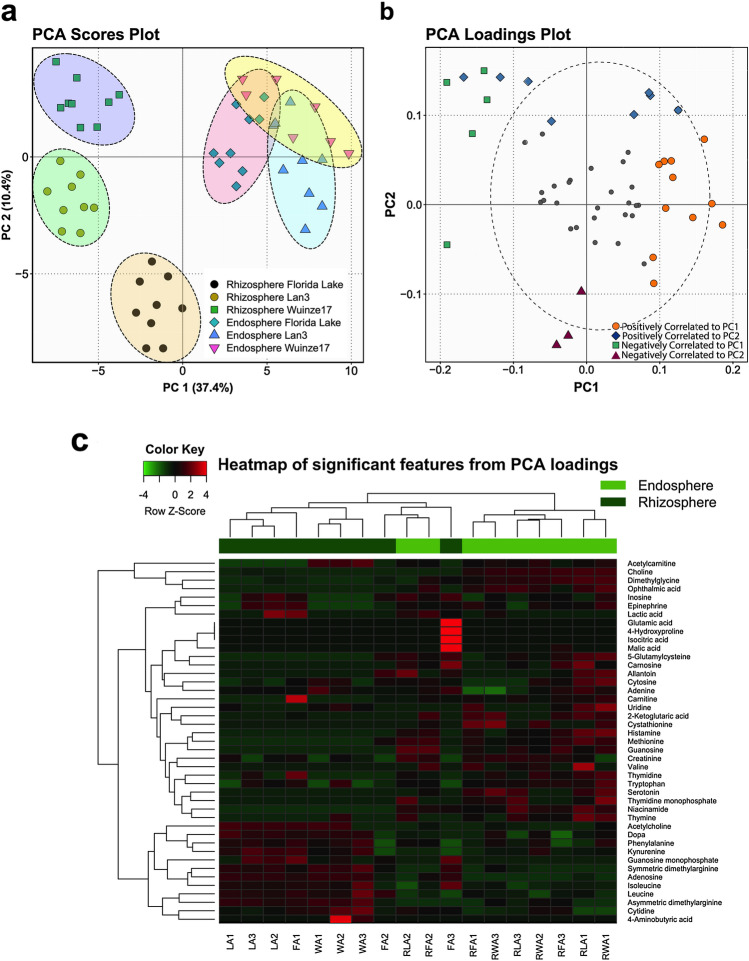
Principal component analysis of metabolic profiles in P. australis endosphere and rhizosphere under different AMD pollution gradient. a Score plot of PC2 versus PC1. Black ellipses represent the 90% confidence intervals for each group. b Loading plot of PC2 versus PC1 showing metabolites with significant loadings at P < 0.1. c Supervised hierarchical clustering heatmap of significant metabolites identified by PC loadings. The color scheme red and green indicate high and low concentrations of metabolites, respectively (Color figure online)

