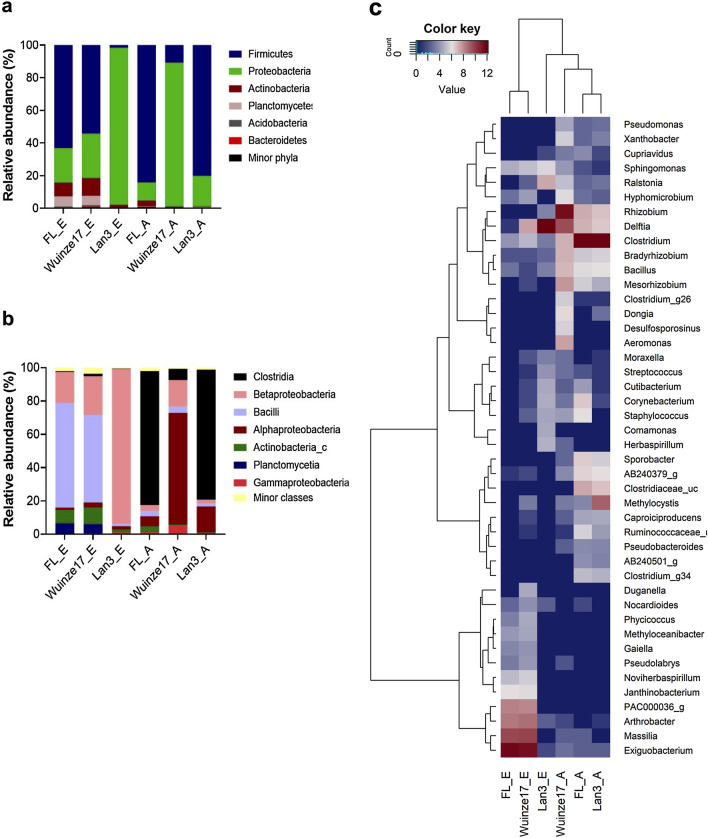
Fig. 3.
Stacked and heatmap plots of the relative abundances of major bacterial taxa. Stacked plots of major phyla (a) and classes (b) associated rhizosphere and the root endosphere of Phragmites australis growing in different AMD polluted environments. FL_E, Wuinze17_E and Lan3_E denotes the rhizospheric samples, while FL_A, Wuinze17_A, and Lan_A are endosphere samples of non-AMD, mid-AMD and high-AMD sites, respectively, and. c Heatmap of log2 normalized counts of the 40 most abundant genera. The heatmap color (blue to brown) represent the row z-score of the mean relative abundance from low to high (Color figure online)

