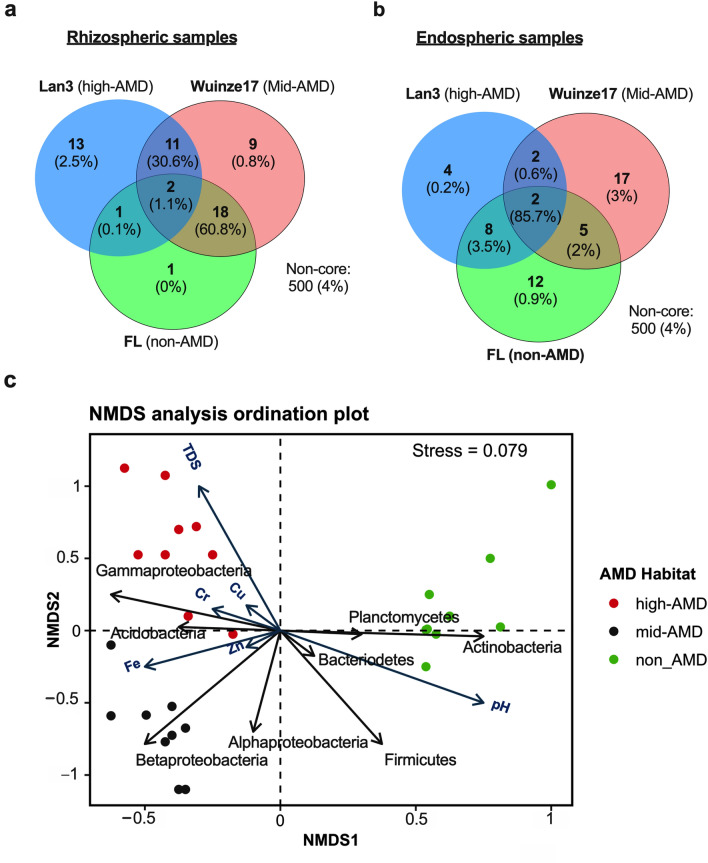
Fig. 4.
Venn diagrams of core microbiome and nonmetric multidimensional scaling (NMDS) analysis plot. Venn diagram showing number of unique and shared OTUs associated with rhizosphere a and root endosphere b of Phragmites australis under different AMD environments. c NMD plot derived from the Weighted Unifrac showing the association of bacterial communities and metabolites with the environmental variables: pH, TDS, Fe, Cr, Cu and Zn in the rhizosphere of P. australis under differing AMD pollution

