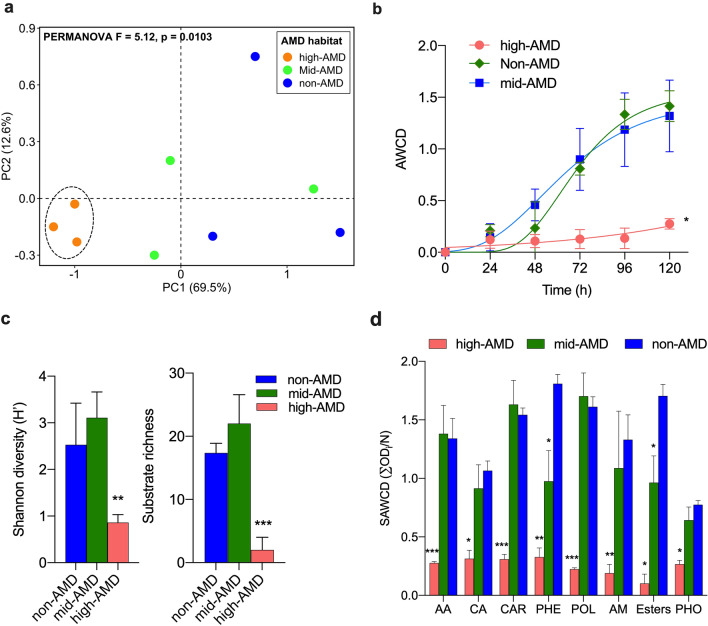
Fig. 5.
Community-level patterns of rhizosphere microbial carbon metabolism in P. australis under different AMD pollution. a PCA plot showing patterns of carbon utilization. The dashed line indicates significant cluster based on PERMANOVA (P < 0.05). b Average well color development (AWCD) at 96 h of incubation. c Shannon diversity index and substrate richness based on CLPP profile at 96 h of incubation. d Substrate average well color development (SAWDC) index at 96 h of incubation for different carbon substrate guilds. AA amino acids, CA carboxylic acids, CAR carbohydrates, PHE phenolic compounds, POL polymers, AM amines, esters; and PHO phosphorylated chemicals. ***, **, and *Indicate significant differences based on Tukey’s test at P < 0.001, P < 0.01, and P < 0.05

