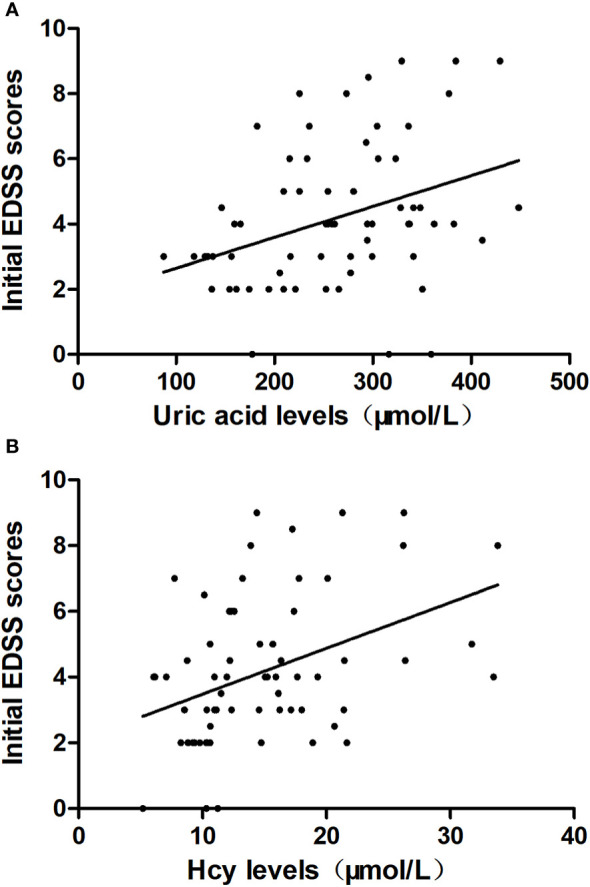
Figure 2.

The correlation between uric acid levels, homocysteine (Hcy) levels and the initial Expanded Disability Status Scale (EDSS) scores. (A) The correlation between uric acid levels and the initial EDSS scores is shown. (B) The correlation between Hcy levels and the initial EDSS scores is shown.
