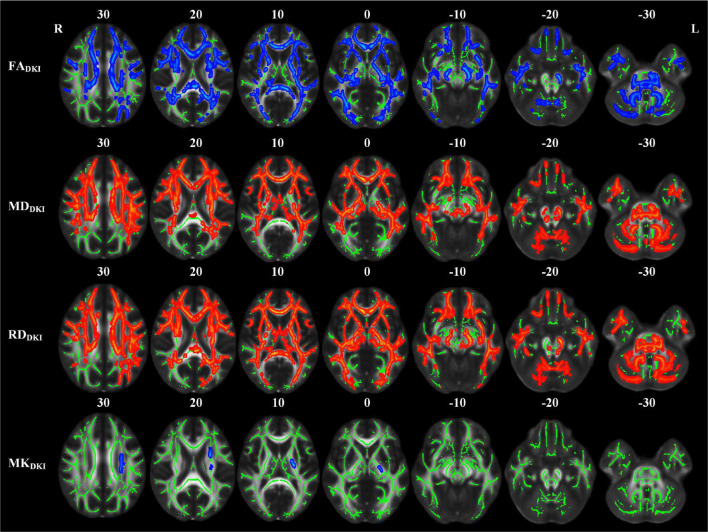
FIGURE 4.
TBSS analyses showed abnormal white matter tracts in the LPI group with DKI-derived parameters. Red indicated white matter tracts with significantly increased parameter values and blue indicated white matter tracts with significantly decreased parameter values. Green represented the mean FA skeleton of all subjects. L and R, left and right; FA, fractional anisotropy; MD, mean diffusivity; RD, radial diffusivity; TBSS, tract-based spatial statistics; DKI, diffusion kurtosis imaging.

