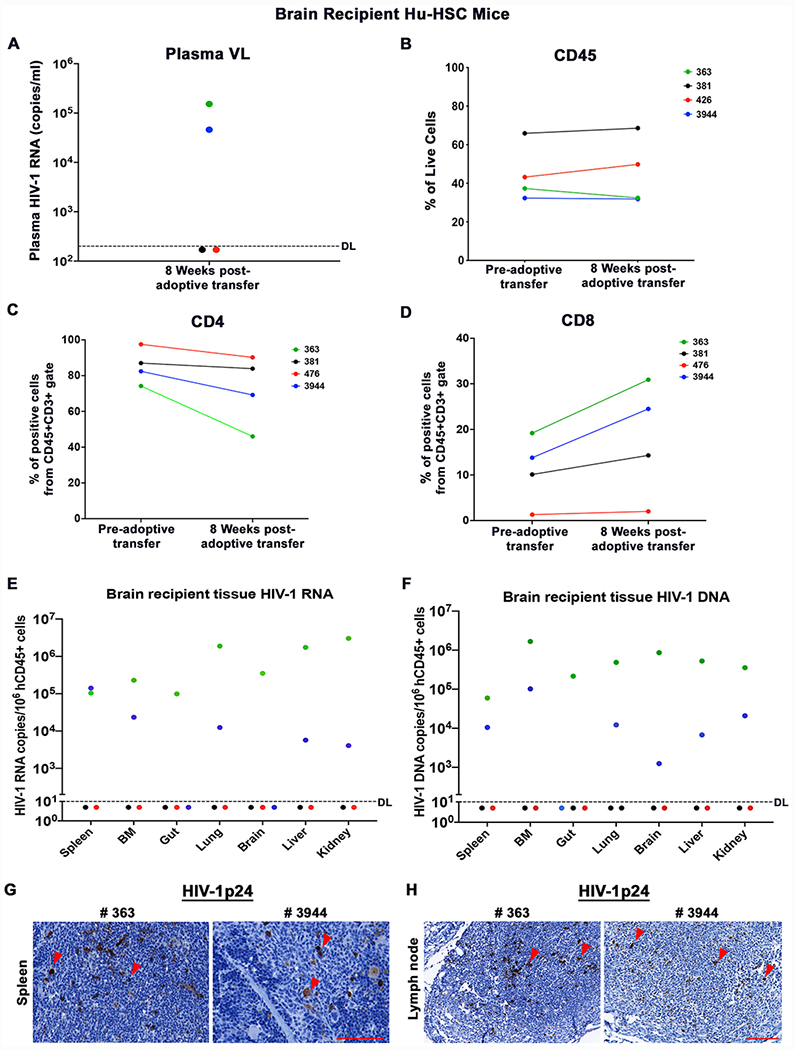
Figure 3. Brain Cell Recipient hu-HSC mice.

(A) Plasma viral load (VL) after 8 weeks of donor hu-HSC mouse brain engraftment. The detection limit (DL) was below 200 copies/ml as shown by the dotted line. (B) Total human cells as stained by flow cytometry using CD45 antibody, at pre-and post-adoptive transfer of brain cells. (C) Peripheral CD4+ and (D) CD8+ T cells at pre- and post-engraftment. (E) Tissue HIV-1 RNA and (F) DNA detection in spleen, bone marrow (BM), gut, lung, brain, liver, and kidney by semi-nested real-time qPCR. The DL was below 10 copies/106 human CD45+ cells as shown by the dotted line. Representative (G) spleen and (H) Lymph node sections from recipient humanized mice (#363 and 3944) showing HIV-1p24 cells as brown color dots by IHC staining. The scale bar indicates 20x and 10x magnifications respectively.
