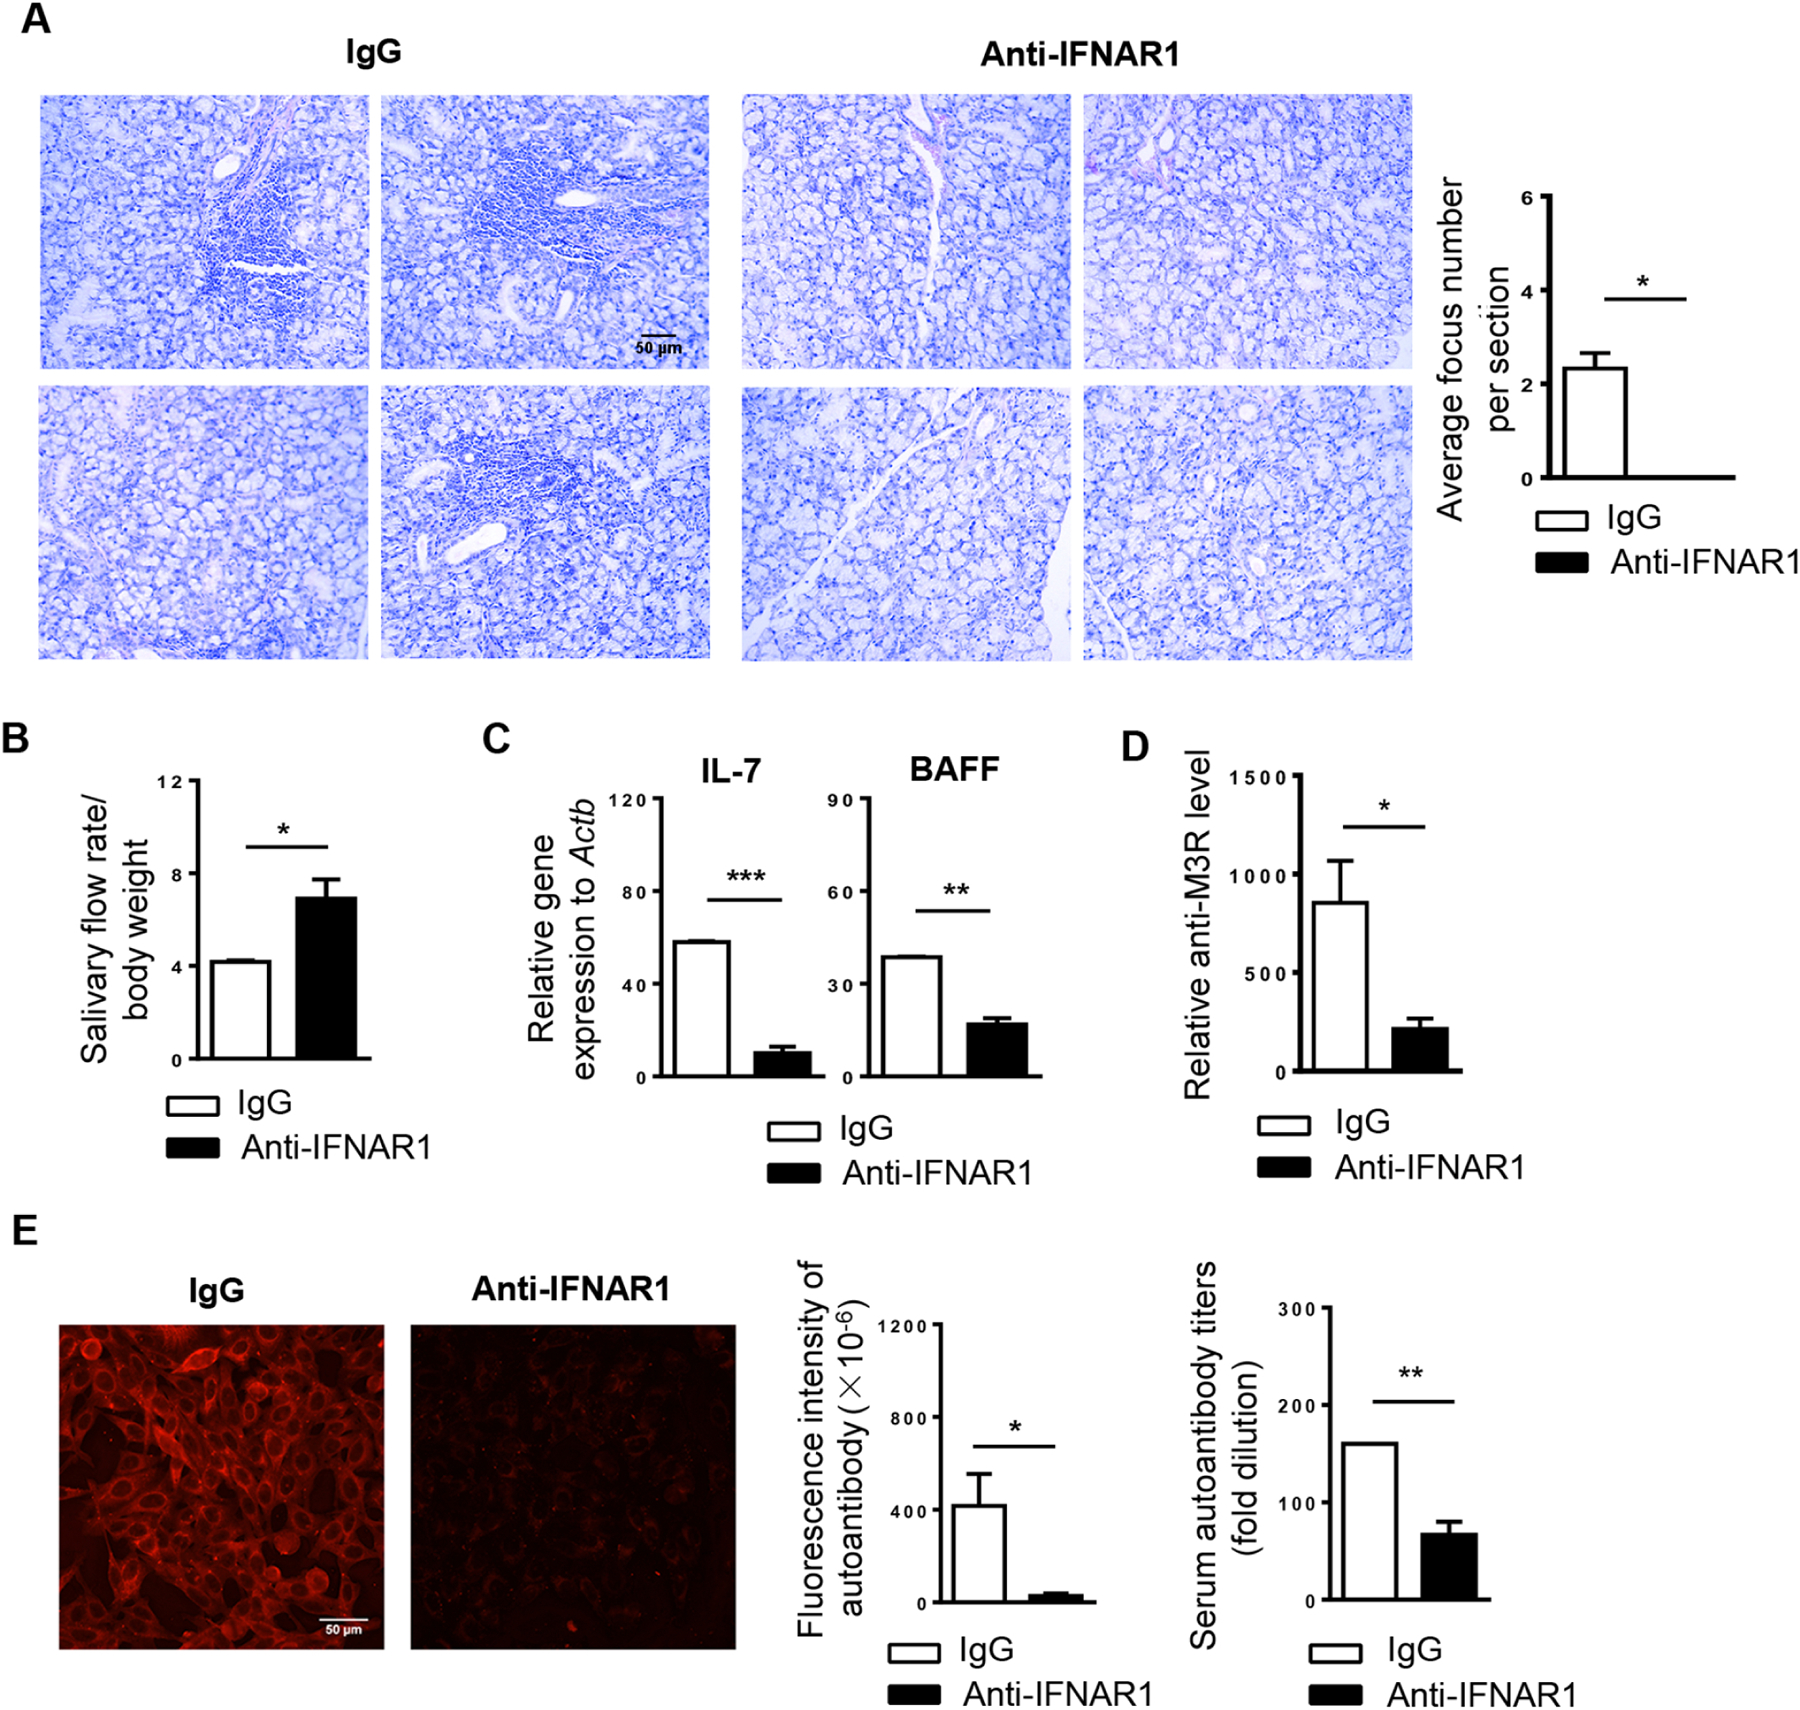
Figure 1. Blockade of IFNAR1 impedes the development of SS-like salivary gland pathologies in NOD mice.

Anti-IFNAR1 antibody or IgG was i.p. administered to 4-week-old female NOD mice, once every 5 days for a total of 4 times. All the analyses were performed when these mice were 10 weeks of age. (A) Tile images of H&E stained areas of one representative SMG sample each treatment group (scale Bar=100 μm). Bar graph shows the average number of leukocyte foci per SMG section. (B) Stimulated saliva flow rate normalized to body weight. (C) Real-time PCR analysis of IL-7 and BAFF mRNA levels in SMGs. Gene expression was presented relative to that of β-actin. (D) Relative level of anti-M3R in the sera as determined by ELISA. (E) Detection of serum autoantibodies (scale bar=50 μm). Bar graphs show the fluorescence intensity of autoantibody staining of the 1:40-diluted sera, left, and the autoantibody titers, right. All data are the representative or average of analyses of 6 mice for each group. Error bars represent the standard error of mean (SEM). *P< 0.05, ** P<0.01, ***P<0.001.
