
Figure 2. pDCs are present in the SMGs of female NOD mice, accompanied by local upregulation of type I IFN-responsive genes.
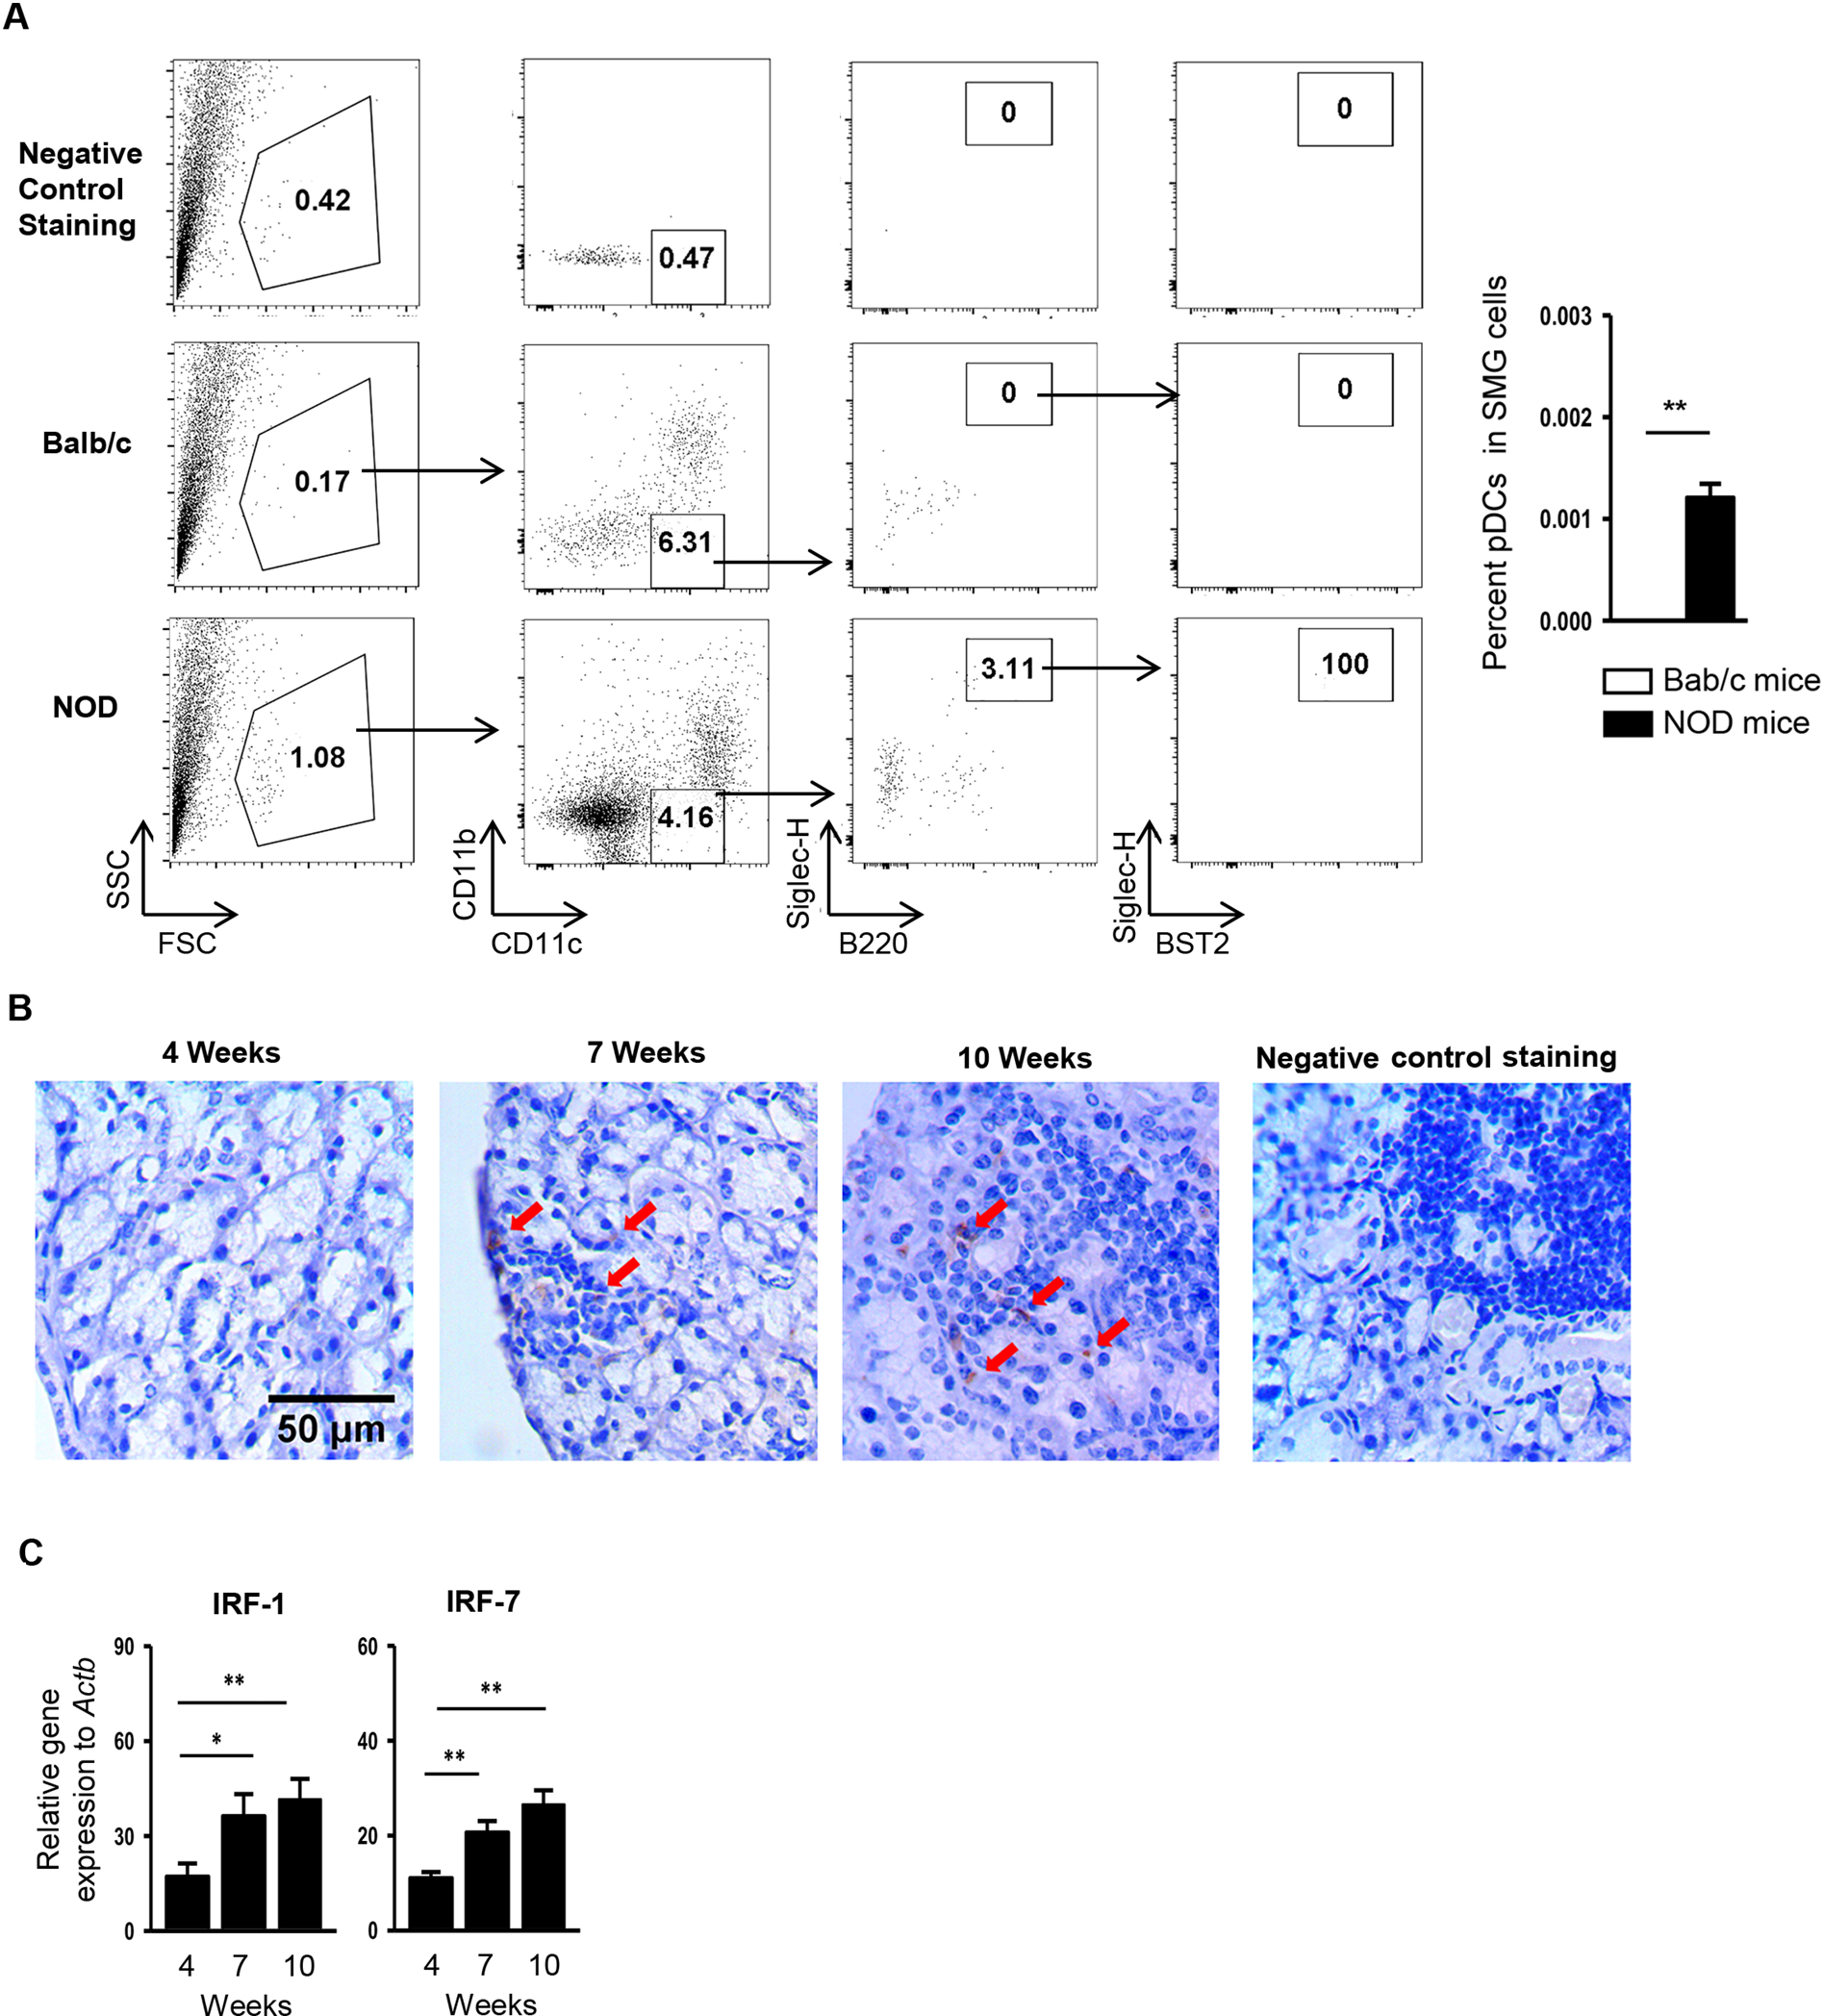
(A) Flow cytometric analysis of the percentage of pDCs (CD11b−CD11cmidB220+Siglec-H+BST2+) in total SMG cells of BALB/c mice and NOD mice aged 13 weeks. The top panels show the negative control staining profile of the cells (a mixture of BALB/c and NOD SMG cells at the 1:1 ratio) under each gating. Bar graph shows the mean percentage of pDCs in total SMG cells, calculated as: Percentage of pDCs in the total SMG cells (%) = % mononuclear cells in SMG cells × % CD11b−CD11cmid cells in mononuclear cells × % B220+Siglec-H+ cells among CD11b−CD11cmid cells × % B220+BST2+ cells among B220+Siglec-H+ cells × 100. (B) Immunohistochemical staining with anti-BST2 antibody of SMG sections from female NOD mice aged 4, 7, and 10 weeks (scale bar = 50 μm). Red arrows indicate the representative areas stained positive for BST2. Negative staining control: SMG sections from female NOD mice aged 10 weeks stained without the without the primary antibody. (C) Real-time PCR analysis of IRF-1 and IRF-7 levels in the SMGs of female NOD mice. The results are presented relative to that of β-actin. All data are representative or the average of analyses of 4–7 mice for each group.