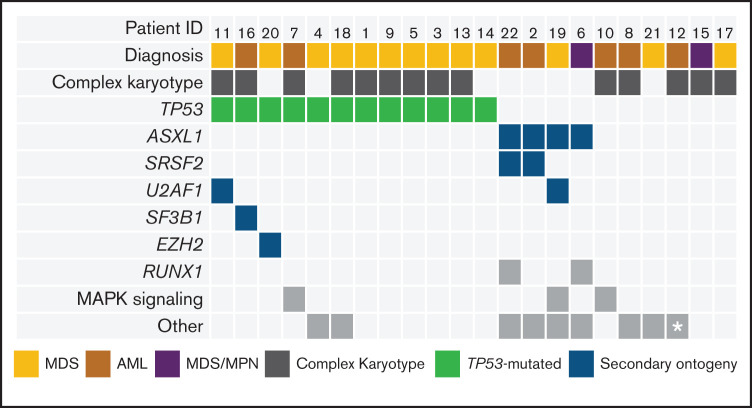
Figure 1.
Baseline disease and genetic profiles of study patients. Comutation plot of diagnostic mutations amenable to MRD tracking. Columns represent individual patients, and rows represent clinical variables or the presence of mutation(s) identified at diagnosis or mutations at screening with VAF ≥2%. This VAF cutoff is suggestive of a diagnostic mutation that was not confirmed at diagnosis due to lack of diagnostic sample or technical assay differences. Asterisk represents a BCR-ABL–mutated case (detected by reverse transcriptase polymerase chain reaction).

