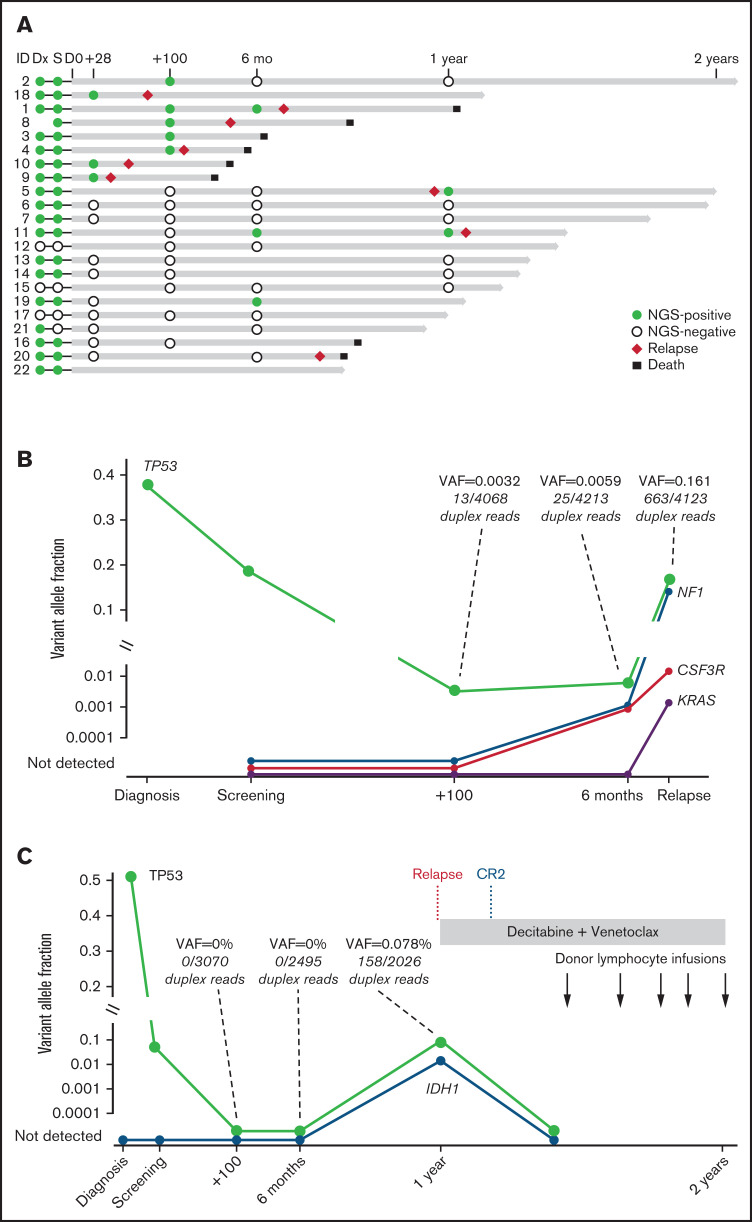
Figure 4.
Serial genetic MRD monitoring before and after transplant. (A) NGS swimmer plot. Each bar represents a patient, with the length of the gray bars indicating follow-up time. Symbols indicate NGS status at serial time points, relapse, and death. Patients arranged according to NGS status at days 28/100, and then by follow-up time. Mutation VAF, relapse, and post-relapse course in patients 1 and 5 are shown. (B) Patient 1 had a baseline mutation in TP53, relapsed >6 months’ posttransplant, and acquired new mutations in NF1, CSF3R, and KRAS. (C) Patient 5 was another TP53-mutated patient who relapsed but later achieved durable CR2 after salvage therapy (decitabine and venetoclax) followed by donor lymphocyte infusion. TP53 VAF and read level support indicated at time points leading up to and including relapse. CR2 indicates timepoint of second complete remission achieved after two cycles of decitabine and venetoclax.

