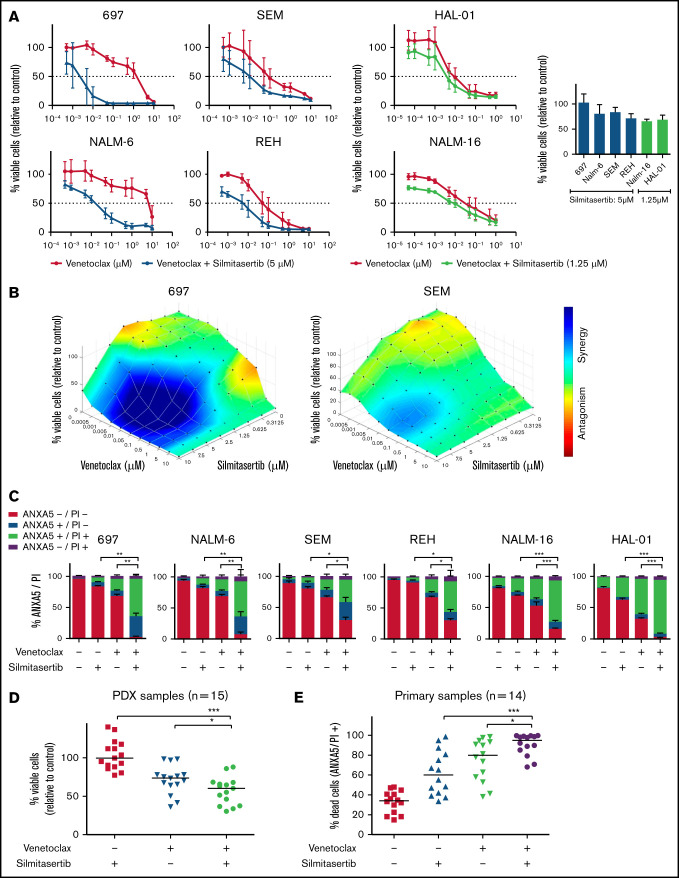
Figure 1.
Synergistic effect of silmitasertib and venetoclax in BCP-ALL models. (A) Viability was assessed in BCP-ALL cell lines (WST-1 assay) 48 hours after treatment with serial dilutions of venetoclax alone or combined with minimally effective silmitasertib concentrations (left). Cell viability after treatment with a minimally effective dose of silmitasertib (5 µM for 697, NALM-6, SEM, and REH cells; 1.25 µM for sensitive cell lines NALM-16 and HAL-01; right). The data are the mean and standard deviation (SD) of 3 independent experiments conducted in duplicate. Complementary data on serial dilutions of venetoclax combined with silmitasertib fixed dose are shown in (supplemental Figure 1C). (B) Combination effects on cell line viability were analyzed 48 hours after treatment with serial dilutions of single and combined compounds (70 combined concentrations: venetoclax alone [n = 10], silmitasertib alone [n = 7], and all combinations of those). Combination effects were determined by a Loewe synergy model (Combenefit software) integrating 3 independent experiments. Each data point represents 1 drug or a combination. Data on 696 and SEM cells are shown as examples. Corresponding plots for the remaining 4 cell lines are shown in Figure 2D and supplemental Figure 2. (C) Annexin A5 and propidium iodide (ANXA5/PI) staining was assessed by flow cytometry in BCP-ALL cell lines 48 hours after treatment with 5 µM silmitasertib and/or 0.05 µM venetoclax, to determine apoptosis. The proportions of vital (ANXA5−/PI−), early apoptotic (ANXA5+/PI−), late apoptotic (ANXA5+/PI+), and necrotic (ANXA5−/PI+) cells are shown. Data represent the mean ± SD of 3 independent experiments. P values were calculated with a 2-tailed, paired Student t test. (D) Scatter plots of PDX cell viability (WST-1 assay, each dot represents 1 PDX sample, line is the median) 24 hours after treatment with 5 µM silmitasertib and/or 0.1 µM venetoclax. The same experiment with 7.5 µM silmitasertib and a corresponding combination effect analysis is shown in supplemental Figure 3. (E) Proportion of dead cells in primary BCP-ALL samples cocultured on patient-derived mesenchymal stem cells. ANXA5 and PI staining were detected by flow cytometry 48 hours after treatment with 5 µM silmitasertib and/or 0.05 µM venetoclax. The same experiment measured at 24 hours, with distribution of molecular subtypes and combination effect analyses, is shown in supplemental Figure 4. P values were calculated using Mann-Whitney U test. *P ≤ .05; **P ≤ .01; ***P ≤ .001, by Mann-Whitney U test. Additional information on applied methods and samples is provided in supplemental Methods.

