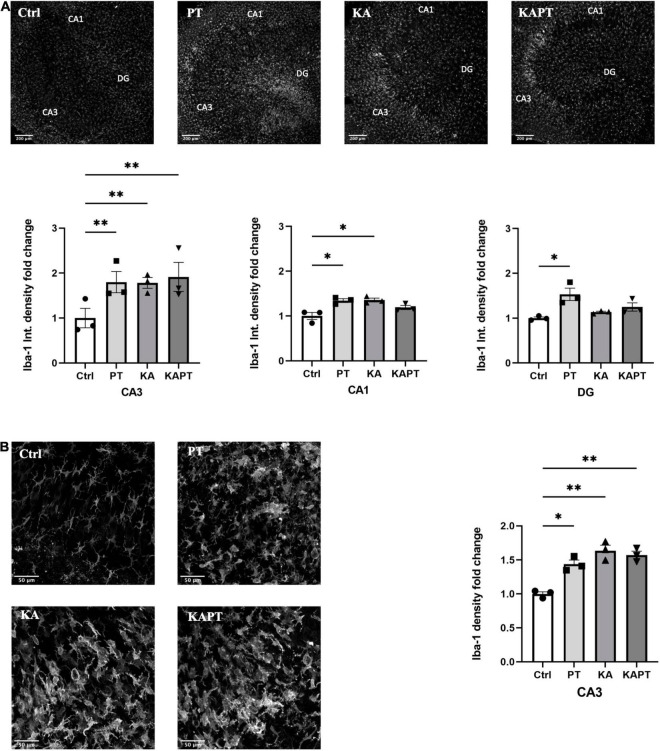
FIGURE 4.
Platinum nanoparticles (PtNPs) cause microglia activation in organotypic hippocampal slices after 24 h of contact. (A) Representative Iba-1 immunostaining of organotypic hippocampal slices under control conditions, PtNPs, kainic acid (KA) treatment, and KA treatment + PtNPs. Bottom charts represent the quantitative analysis of Iba-1 fluorescence intensity in CA3, CA1, and dentate gyrus (DG). (B) Magnified images of Iba-1 stained microglia at the level of the CA3 region, showing altered morphology of cells in all the treatment groups compared to the control. Right chart represents Iba-1 density quantification at the CA3 region for all experimental groups. Data are expressed as Iba-1 fluorescence intensity and density fold change from the value of control slices and presented as means ± standard error of the mean (SEM) (n = 3 independent experiments; 4–6 slices analyzed per group/experiment). Tukey’s test after one–way analysis of variance (ANOVA) was used for statistical analysis. *p < 0.05; **p < 0.01.

