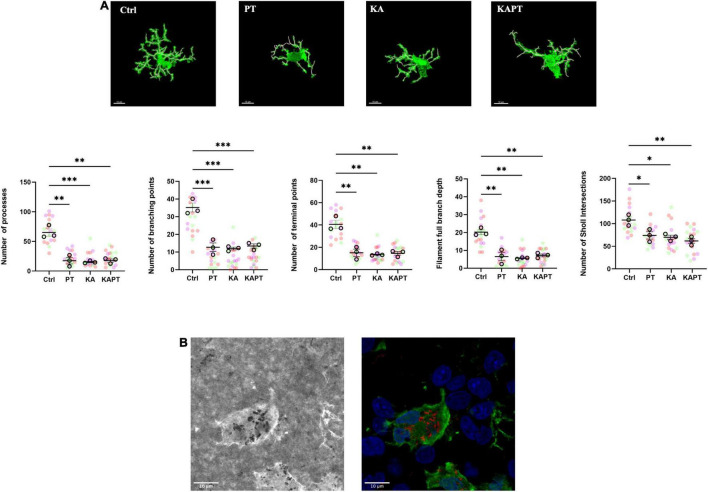
FIGURE 6.
Platinum nanoparticles (PtNPs) cause morphological alterations of microglia after 24 h of contact. (A) Representative Iba-1 immunostaining of microglia at 63X magnification, showing alteration in microglia morphology in all the treatment groups compared to controls. White cylinders highlight branch complexity. Bottom charts represent microglia morphology quantification showing significant differences in the number of processes, branching and terminal points, as well as the branch complexity and ramification in all the treatment groups compared to controls. (B) Left: representative brightfield image showing PtNPs internalization by microglia. Right: merge of the brightfield image with PtNPs colored in red with the fluorescent image showing microglia in green and nuclei in blue. Dots in the dot plots represent individual cells. Data are presented as means ± standard error of the mean (SEM) (n = 3 independent experiments; 5–8 cells analyzed per group/experiment). Tukey’s test after one–way analysis of variance (ANOVA) was used for statistical analysis. *p < 0.05; **p < 0.01; ***p < 0.001.

