
Figure 2.
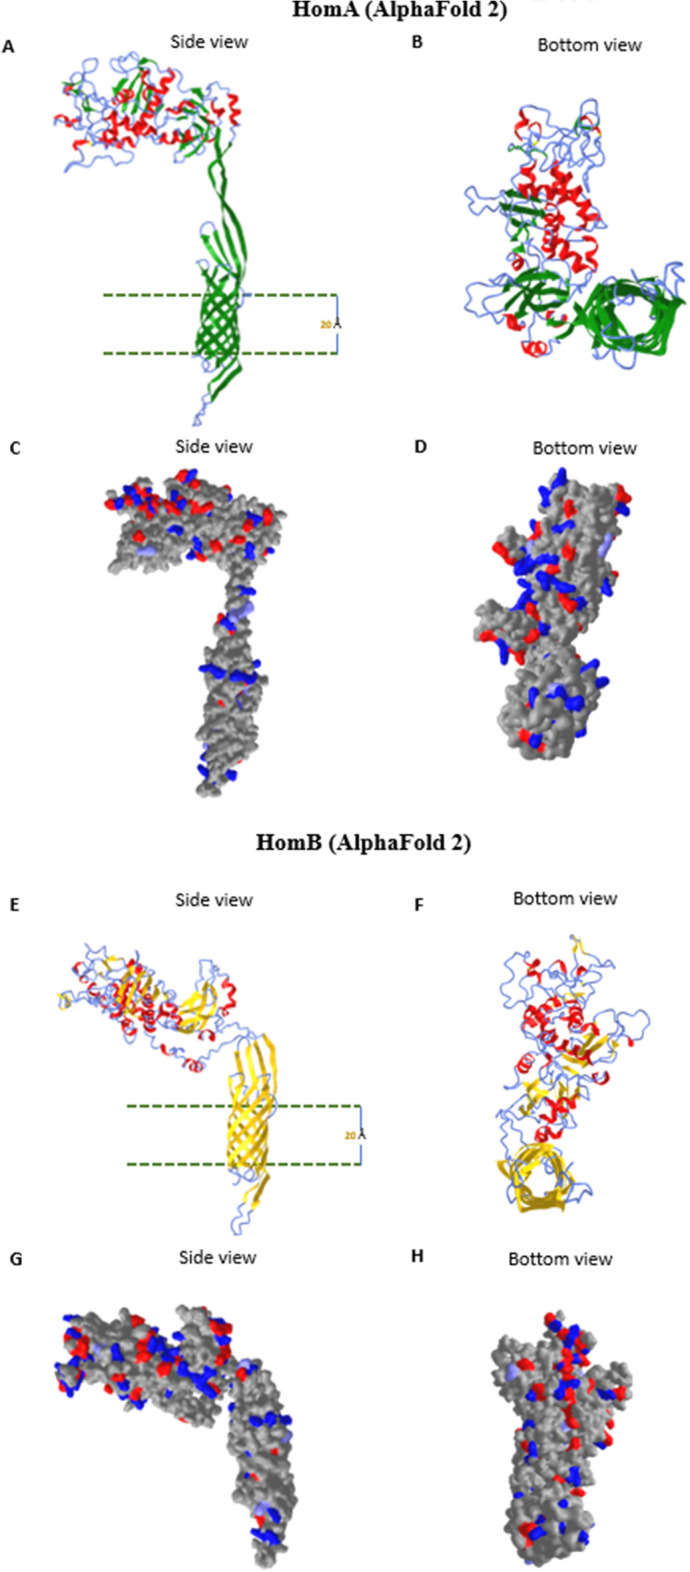
Alphafold 2 3D structure prediction of HomA and HomB. (A–H) 3D structure predictions of HomA and HomB (without signal peptide) using Alphafold228, side and bottom view for HomA from left to right (A,B) β-sheets (green), α-helices (red) and coils (blue); side and bottom view for HomB from left to right (E,F) β-sheets (yellow), α-helices (red) and coils (blue). (C,D) molecular surface view of charged residues of HomA and (G,H) for HomB.