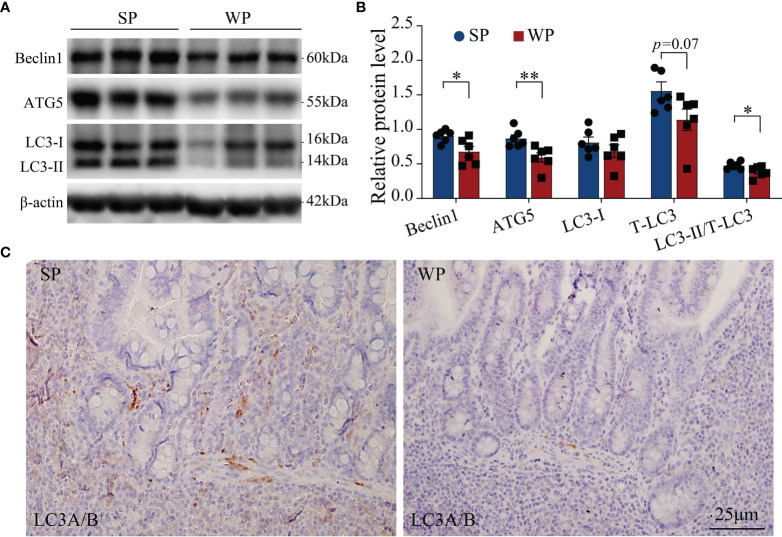
Figure 3.
Autophagy-related signaling was suppressed in WPs relative to that in SPs. (A, B) The expression of autophagy-related proteins in colonic tissue was determined by immunoblotting. (C) Representative images of immunohistochemistry for LC3A/B (n = 6). Scale bars, 25 μm. The data are presented as the means ± SEM, Student’s t-test, *P < 0.05, **P < 0.01; n = 6.

