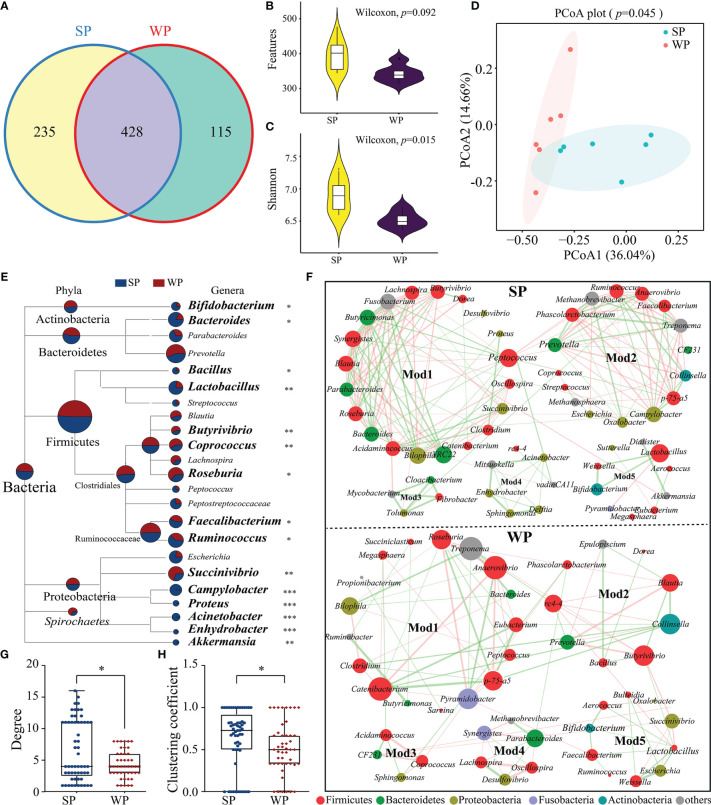
Figure 5.
Differences in gut microbiota structure and co-occurrence patterns between the SP and WP groups. (A) Venn diagram displaying the numbers of identified amplicon sequence variants (ASVs) in the SP and WP groups. (B, C) Differences in alpha diversity in the gut bacteria were assessed based on features and the Shannon index. (D) Principal coordinate analysis (PCoA) plots based on the Bray–Curtis distances identified distinct clusters between the SP and WP groups. (E) MEGAN taxonomic tree emphasized the evolutionary relationship and differences in abundance of microorganisms in the SP and WP groups. Relative abundance is displayed in a colored pie-chart; the size of the pie-chart indicates relative sequence abundance. (F) Microbial co-occurrence patterns in the colon ecosystems of the SP and WP groups were visualized using network diagrams. Co-occurrence relationships with a strong Spearman’s correlation coefficient (|ρ value| >0.5 and P < 0.05) were selected and formed five modules in both groups; the size of each node is proportional to the degree of correlation. Phylum information for each node is indicated by color. The edges represent the correlation between the two genera, the thickness of the edge represents the strength of the correlation, orange represents a positive correlation, and green a negative correlation. (G, H) Topological properties (degree and clustering coefficient) of co-occurrence networks for bacterial communities in the SP and WP groups. All data are presented as means ± SEM. Wilcoxon rank sum test for (B, C, F); PERMANOVA for (D); and the Mann–Whitney non-parametric test for (G, H). *P < 0.05, **P < 0.01, ***P < 0.001; n = 6.

