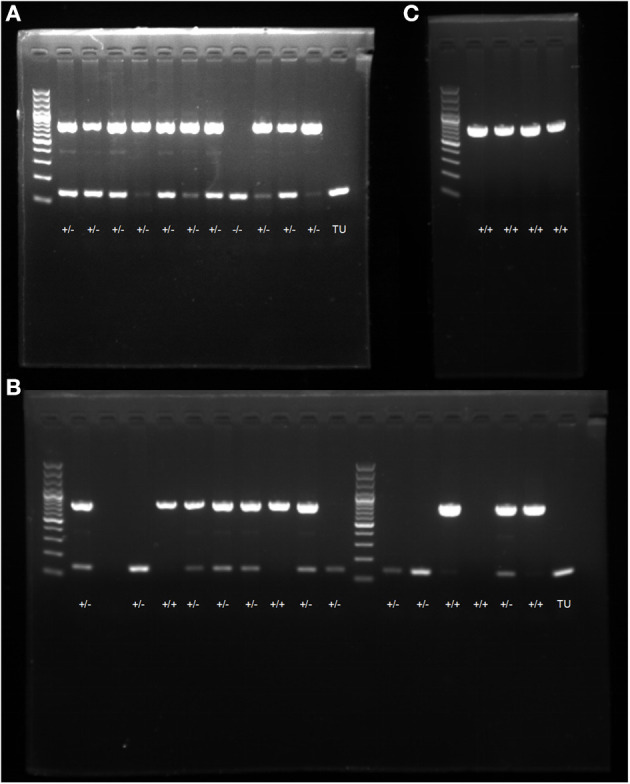
Figure 3.

PCR electrophoresis diagram. (A) screening and genotype identification of F1 generation zebrafish; (B) identification of positive expressions of genotypes in zebrafish; (C) self-progeny genotype identification of F1 generation heterozygous zebrafish.
