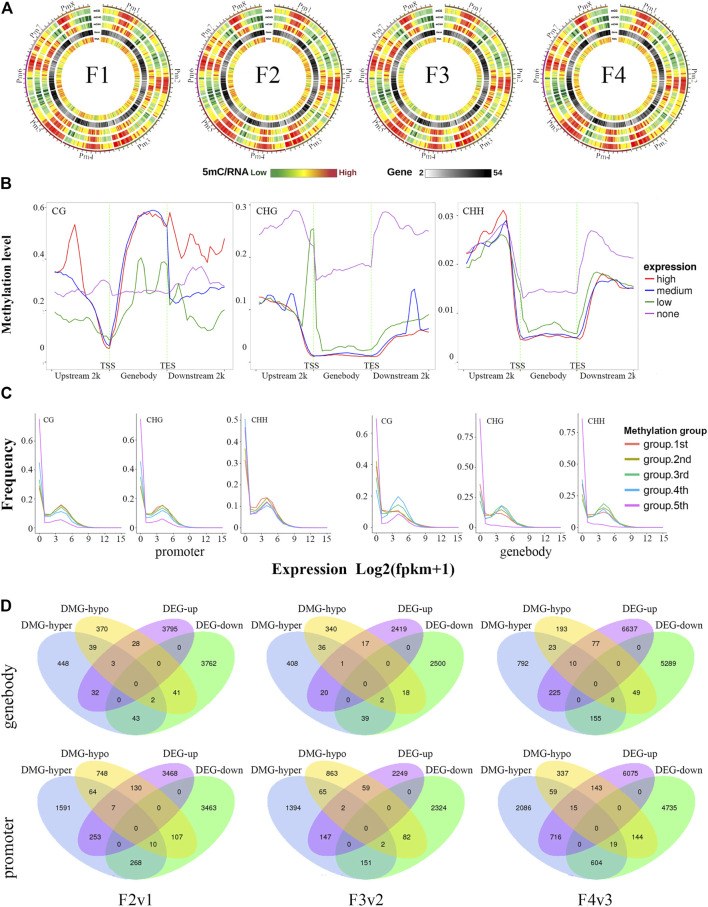
FIGURE 6.
Correlation between ML and expression level of genes, shown in three different CX contexts. (A) The overall relationship between ML and expression level on chromosomes. (B) The MLs of gene body and regions 2 kb up- and downstream of it in different CX contexts of genes under different expression levels. FPKM_25% and FPKM_75% refer to values at the boundary of the 25th and 75th percentiles of expression levels, respectively. Each region of each gene was divided equally into 50 bins, and the MLs of all CX sites in each bin were averaged as the ML of the bin. (C) The expression level distribution frequencies of six groups of genes with different MLs from low to high, shown separately for gene body and promoter regions. DNA methylation levels were classified into five groups: group 1 (red; 0 < methylation level < level_20%); group 2 (yellow-green; level_20% ≤ methylation level < level_40%); group 3 (green; level_40% ≤ methylation level < level_60%); group 4 (turquoise; level_60% ≤ methylation level < level_80%); and group 5 (blue; methylation level ≥ level_80%). Level_20%, _40%, _60%, and _80% represent values at the boundaries of the 20th, 40th, 60th, and 80th percentiles of methylation levels. (D) Venn plots showing the numbers of DEGs that were up- or downregulated in each comparison. The terms “hyper-” and “hypo-” represent DMRs within DEGs that were hypermethylated and hypomethylated, respectively. The results are displayed according to DMRs within promoter or gene body regions.

