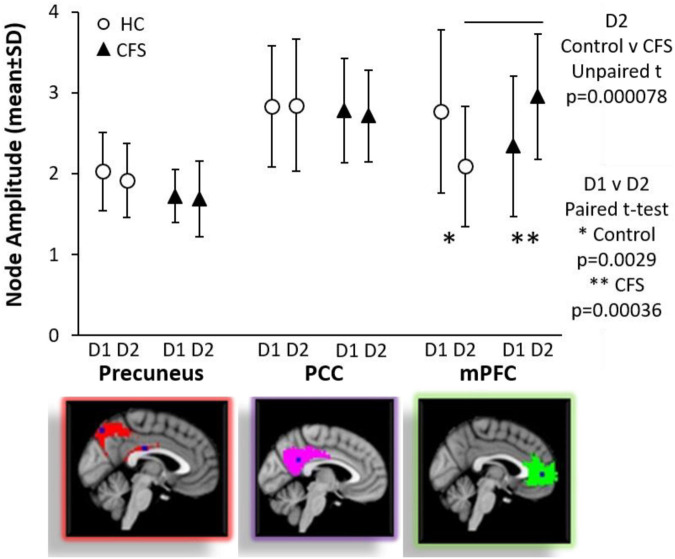
FIGURE 2.
Default mode network nodes. Node amplitude strengths were compared by ANOVA and Tukey Honest Significant Difference for differences between groups and by paired Student’s t-test for exercise effects between days within groups. DMN_PCC (red in top figure on right) and DMN_Prec (magenta in middle figure on right) were equivalent between control and CFS and between preexercise and postexercise scans. In contrast, exercise had significant effects on the anterior node in the DMN_mPFC (green in the bottom figure on the right). Node amplitude strengths were equivalent for CFS and control preexercise. Exercise caused a significant decrease in control (∗p = 0.0029 by paired test), but a significant increase for CFS (∗∗p = 0.00036 by paired test). As a result of the dynamic changes, CFS had significantly higher signal than control postexercise (line above error bars, p = 0.000078). Mean ± SD.

