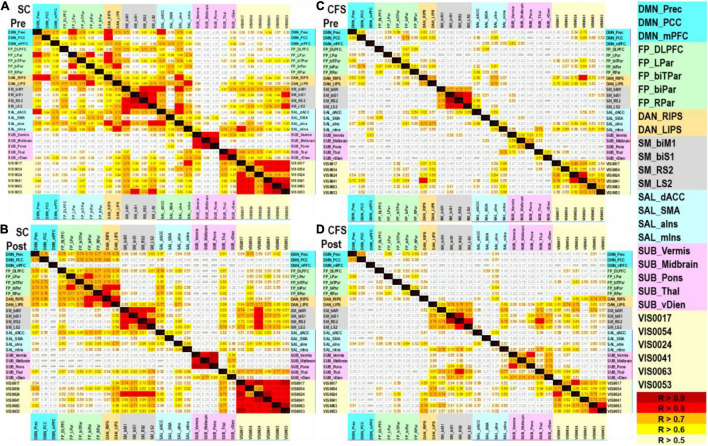
FIGURE 3.
Pearson correlation matrices. Age and gender regressed BOLD amplitude data were correlated for (A) sedentary control preexercise, (B) sedentary control postexercise, (C) CFS preexercise, and (D) CFS postexercise. Correlations are shown with R > 0.5 (light yellow), R > 0.6 (yellow), R > 0.7 (orange), R > 0.8 (red), and R > 0.9 (dark red) that were all p < 0.001 uncorrected. There were no significant negative correlations. Networks and nodes were highlighted in color on the right: DMN cyan, FPN green, DAN orange, SMN gray, SAL blue, SUB pink, and VIS yellow.

