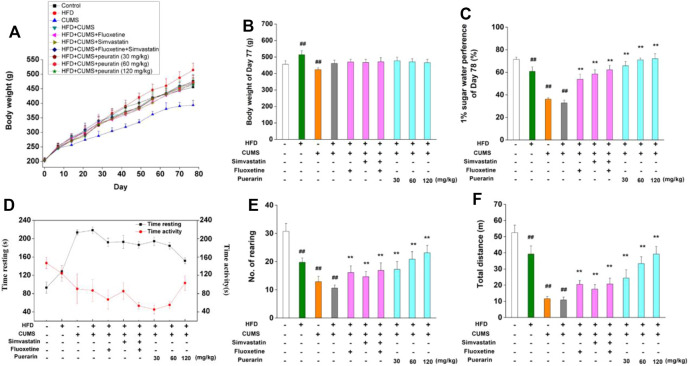
FIGURE 2.
Effect of puerarin on body weight, sucrose preference, and depression-like behavior. (A) Body weight of all rats was recorded at days 0, 7, 14, 21, 28, 35, 42, 49, 56, 63, 70, and 77. (B) Body weight at the 77th day was statistically analyzed. (C) Water and sucrose solution consumption at the 78th day were carried out, and the sucrose preference rate was calculated. The time resting or activity (D), rearing numbers (E), and total distance (F) traveled during the last 4 min were recorded and statistically analyzed. Values are expressed as mean ± S.E.M (n = 8). ## p < 0.01 vs. the normal control group; ** p < 0.01 vs. the HFD/CUMS group.

