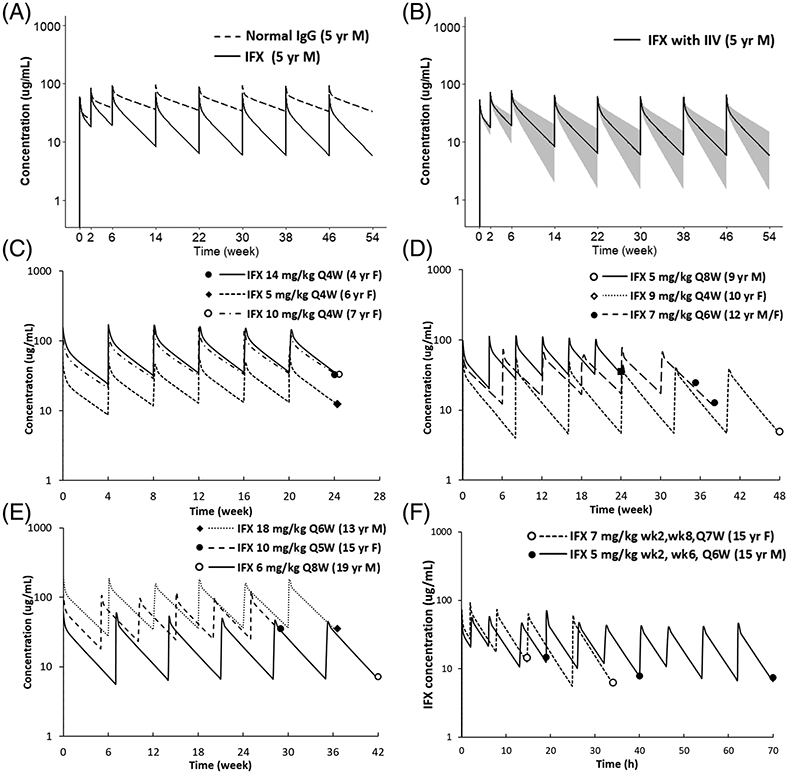
FIGURE 2.

(A) Comparison of plasma PK profiles of a typical antibody and infliximab. Figure displays simulated plasma PK profiles of a typical antibody and infliximab in a 5-year-old male (weight 18.3 kg) after receiving infliximab 5 mg/kg at weeks 0, 2 and 6 and then every 8 weeks. (B) Population simulation of infliximab plasma PK profiles. Simulated infliximab plasma PK profiles in the 5-year-old male paediatric population (weight 18.3 kg, CV 14.5%) accounting for inter-individual variability of Kdeg. The black line represents the median, and the shaded area represents the 90% CI. (C–F) represent predicted and observed infliximab plasma PK profiles in paediatrics for different ages, sex and treatment indications (i.e., induction vs. maintenance). Figure displays individual prediction (solid lines) and observed infliximab concentration (solid dots) for (C) 4–7 years every 4 weeks maintenance therapy; (D) 8–12 years every 4–8 weeks maintenance therapy; (E) 13–20 years every 5–8 weeks maintenance therapy; (F) 15 years induction therapy
