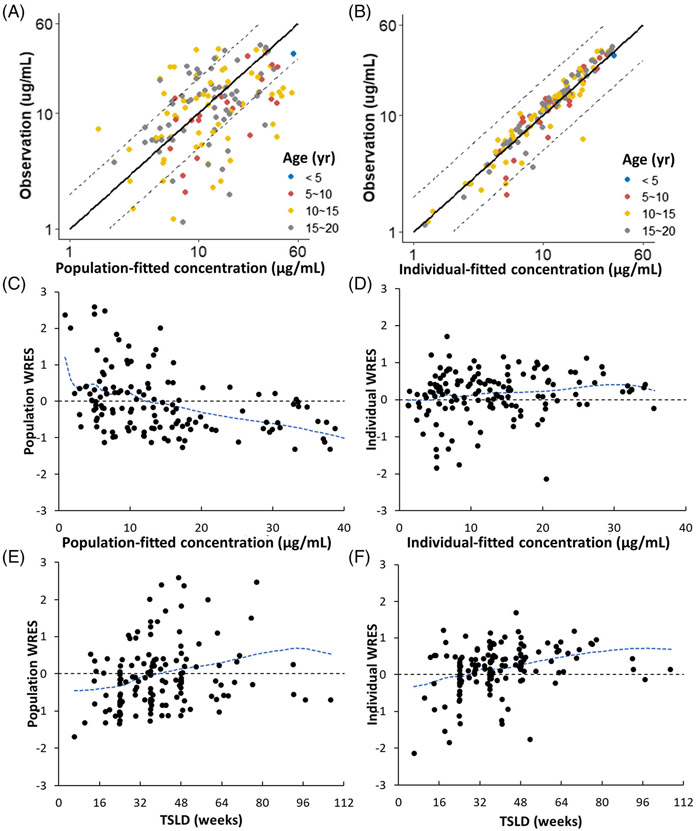
FIGURE 3.
Diagnostic plots. The plots of population (A) and individual (B) prediction vs. observed concentration along with the identity line (solid line) and two-fold boundary lines (dashed lines) stratified by different age groups. The plots of population (C) and individual (D) weighted residuals vs. time since first dose, and population (E) and individual (F) weighted residuals vs. observations, along with spline interpolation (blue lines)

