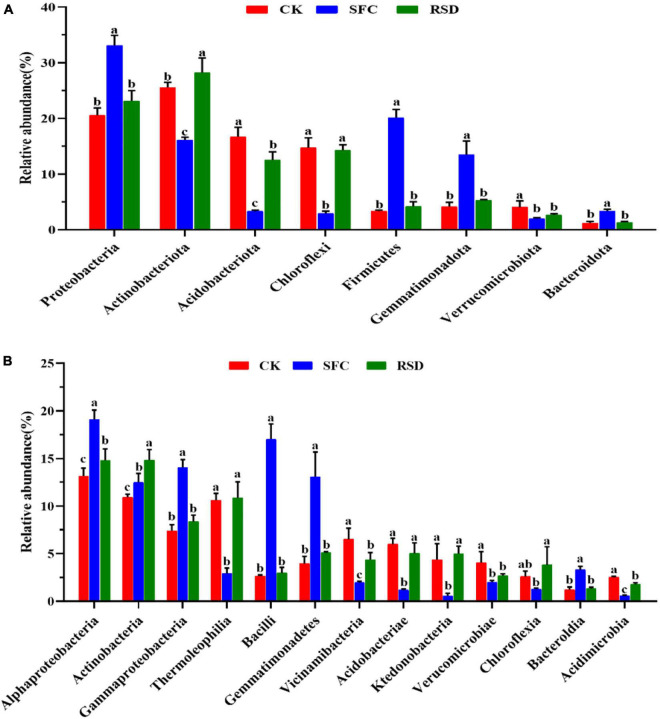
FIGURE 3.
Relative abundances of dominant bacterial phylum (A) and classes (B) in different treatments. Error bars indicate the standard errors of the means of four replicates. The letters indicate significant difference at p < 0.05 according to one-way analysis of variance (ANOVA) among treatments.

