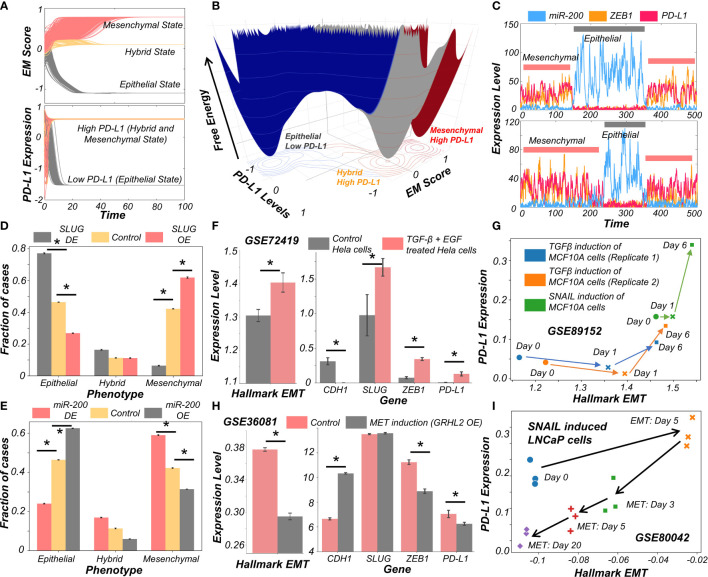
Figure 2.
Evidence for causal links between EMT associated genes and PD-L1 levels. (A) Dynamics of EM score and PD-L1 showing presence of epithelial, hybrid, and mesenchymal phenotypes and their corresponding PD-L1 levels, when simulated from multiple initial conditions. (B) Probability landscape on the PD-L1 and EM score plane, with the valleys representing the stable states possible in the system. Three distinct states – Epithelial/PD-L1 low, Hybrid E-M/PD-L1 high, and Mesenchymal/PD-L1 high – are observed. (C) Stochastic simulations of gene regulatory network via sRACIPE showing spontaneous switching between different states. (D) Simulation results showing the fraction of cases of epithelial, hybrid, and mesenchymal phenotypes under control (yellow), SLUG DE (grey) and SLUG OE (orange) conditions. (E) Same as D but for miR-200 OE (grey) and miR-200 OE (orange) conditions. (F) Activity/Expression levels of Hallmark EMT and PD-L1 levels in Hela cells induced to undergo EMT (GSE72419). (G) Two-dimensional Hallmark EMT and PD-L1 plot showing trajectory of MCF10A cells induced with TGFβ or SNAIL (GSE89152). (H) Activity/Expression levels of Hallmark EMT and PD-L1 levels in HMLE cells where MET has been induced via overexpression of GRHL2 (GSE36081). (I) Two-dimensional Hallmark EMT and PD-L1 plot showing trajectory of LNCaP prostate cancer cells that have been induced with SNAIL to undergo EMT followed by removal of signal to induce MET (GSE80042). * denotes p-val < 0.05 as assessed by a two-tailed Students t-test assuming unequal variances.

