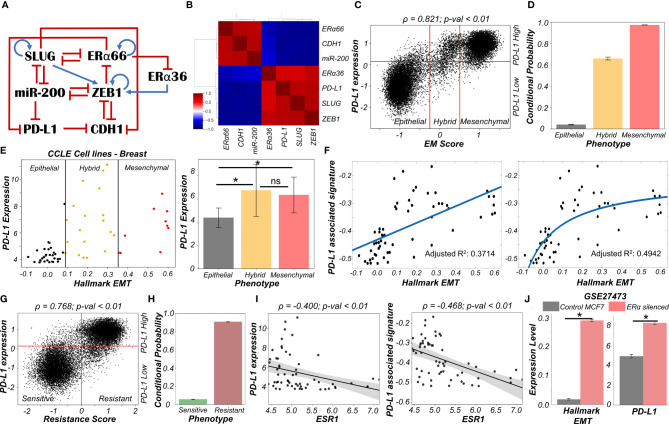
Figure 4.
Association of high PD-L1 levels with acquisition of a reversible drug resistant phenotype in ER+ Breast cancer. (A) Regulatory network interplay of EMT regulators, estrogen receptor isoforms (ERα66, ERα36) coupled with PD-L1. Blue arrows stand for activation links, red hammers for inhibitory links. (B) Pairwise correlation matrix using Spearman correlations showing the existence of 2 “teams” of players – SLUG, ZEB1, ERα36, PD-L1 and CDH1, miR-200 and ERα66 – with mutually antagonistic associations. (C) Scatter plot of PD-L1 levels and EM score. Spearman’s correlation coefficient (ρ) and corresponding p-value (p-val) are reported. (D) Bar plot representing conditional probability of a phenotype being PD-L1 high given that it belongs to a given EMT phenotype. (E) Scatter plot showing correlation between PD-L1 levels and the Hallmark EMT signature in breast cancer specific cell lines from CCLE. The boundaries between epithelial, hybrid and mesenchymal phenotypes are based on trisection of the entire range of Hallmark EMT scores of all cell lines in CCLE (left). Quantification of PD-L1 levels of breast cancer cell lines belonging to different EM status (right). * denotes p-val < 0.05 as assessed by a two-tailed Students t-test assuming unequal variances. (F) Scatter plot showing linear vs Michaelis-Menten curve fit to a scatter plot of PD-L1 associated and Hallmark EMT signatures. (G) Scatter plot of PD-L1 levels and Resistance score classified as high (>0) vs low (<0). Spearman’s correlation coefficient (ρ) and corresponding p-value (p-val) are reported. (H) Bar plot representing conditional probability of a phenotype being PD-L1 high given that it is sensitive vs. resistant state. (I) Scatter plot showing a significant negative correlation between PD-L1 levels and PD-L1 associated signature and ESR1 expression levels in breast cancer cell lines from CCLE. (J) Activity/Expression levels of Hallmark EMT and PD-L1 levels in MCF7 ER+ breast cancer cells with control and ERα silenced cases (GSE27473). * denotes a statistically significant difference (p-val < 0.05) between the represented groups assessed by a two-tailed Students t-test assuming unequal variances. ns represents results that are not statistically significant (p-val > = 0.05).

