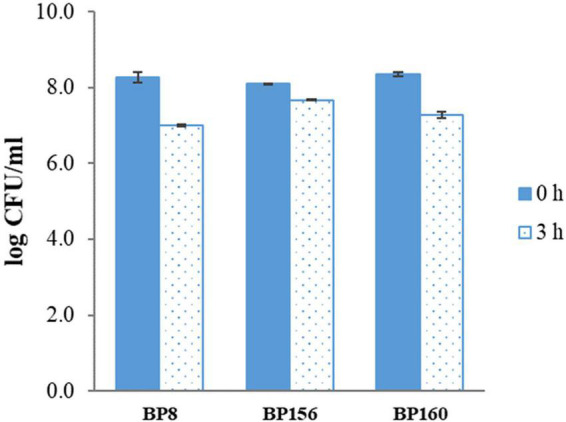
FIGURE 1.

The acid tol erance activity of LAB isolates after 3-h incubation at pH 2.5 (means ± SD). Error bars indicate the standard deviation from three independent experiments.

The acid tol erance activity of LAB isolates after 3-h incubation at pH 2.5 (means ± SD). Error bars indicate the standard deviation from three independent experiments.