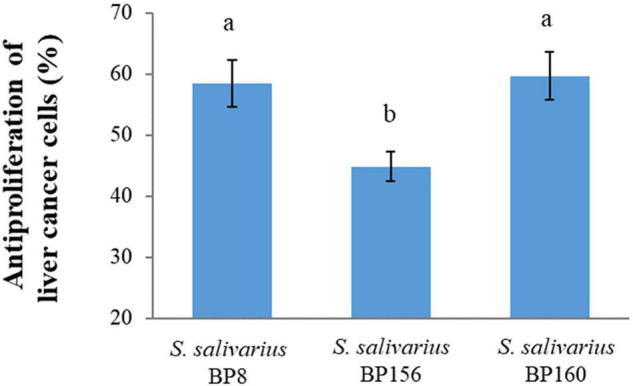
FIGURE 4.

Antiproliferation activity of S. salivarius strains in HepG2 cell lines (means ± SD). The letters above the bars denote significant difference (P < 0.05) as determined by Duncan’s multiple range test. Error bars indicate the standard deviation from three independent experiments.
