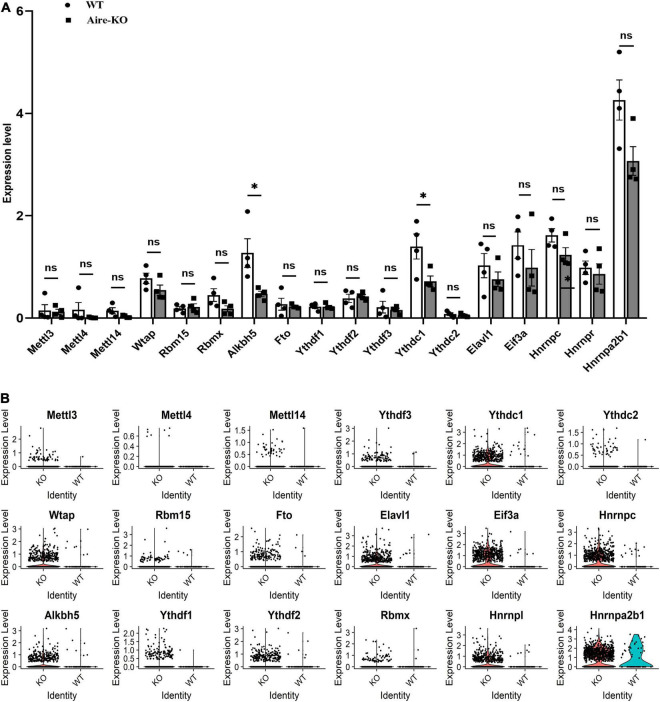
FIGURE 1.
scRNA-seq analysis of Aire– /– retinal microglia. (A) Bar charts showing the expression levels of m6A writers, erasers and readers in WT and Aire–/– retina microglia (n = 4). (B) Violin plots showing the expression levels of m6A writers, erasers and readers in WT and Aire–/– retinal microglia. *P < 0.05 by Student’s t-test; n.s., no significance. The data are presented as the mean ± SD.

