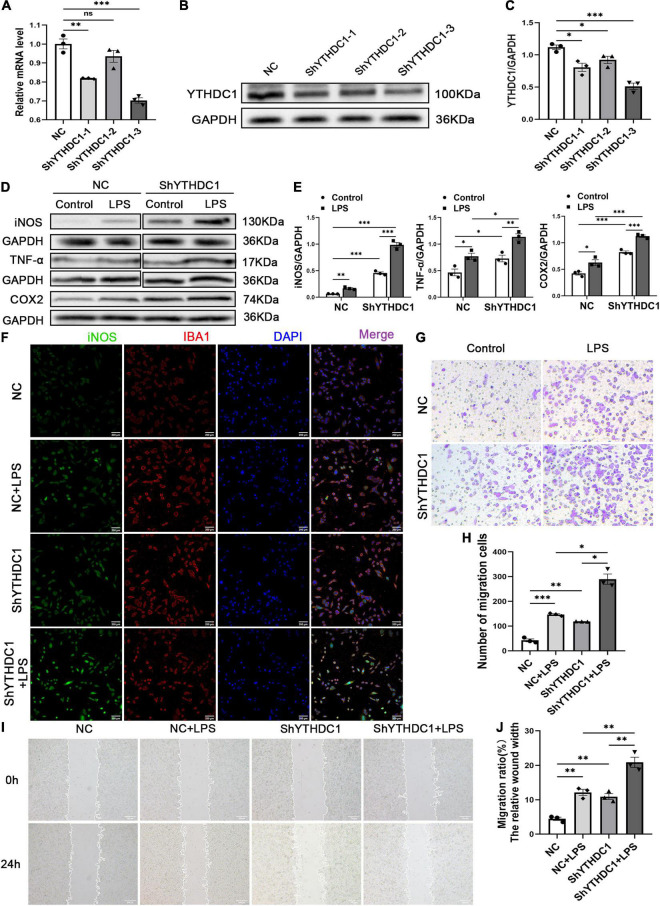
FIGURE 3.
YTHDC1 depletion facilitates BV2 microglia M1 activation and migration in vitro. (A–C) The transfection efficiency of YTHDC1 knockdown in BV2 cells was measured by qRT-PCR (A) and Western blotting (B,C). (D,E) Western blot analysis of iNOS, COX2 and TNF-α in the different groups. (F) Immunofluorescence analysis of iNOS in the different groups. (G,H) Wound healing assays in the different groups. (I,J) Transwell assays in the different groups. NC: cells transfected with negative control shRNA; ShYTHDC1 (1, 2, and 3) or ShYTHDC1: cells transfected with YTHDC1 shRNA. *P < 0.05, **P < 0.01, and ***P < 0.001 by Student’s t-test. The data are presented as the mean ± SD. (n = 3). Scale bar, 200 μm.

