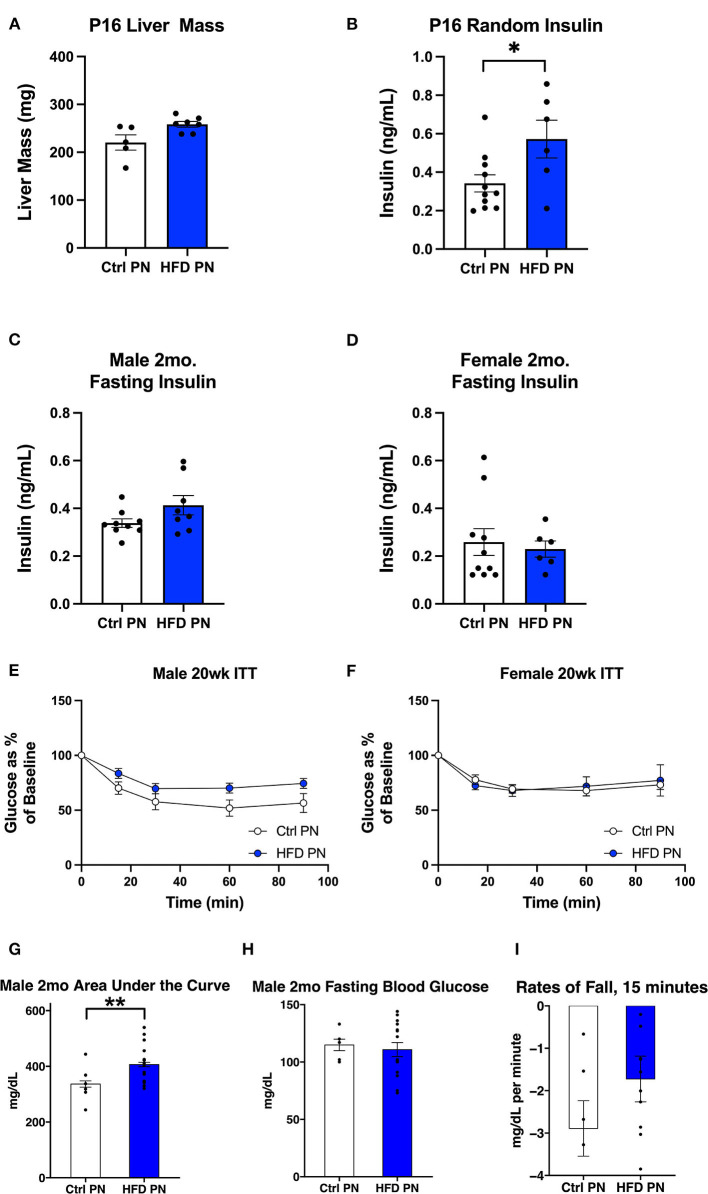
Figure 2.
Offspring metabolic characteristics after lactational exposures. All data are presented as a litter average with the n reflecting the number of litters studied. All white values are for Ctrl PN and blue are for HFD PN offspring. (A) Post-natal day 16 (P16) Liver Mass (B) P16 Fed Insulin (C). Fasting insulin at 2 months in male offspring (D). Fasting insulin at 2 months in female offspring (E). Insulin tolerance test at 5 months in male offspring (n = 6–7 litters) (F). Insulin tolerance test at 5 months in female offspring (n = 4–7 litters) (G–I) constitute further analysis of the 5-month male ITT (G). The area under the curve from 100% for the ITT glucose values (H). Fasting blood glucose at the start of the ITT (I). The rate of fall in blood glucose from the baseline to 15 min during the test. Ctrl, control; HFD, high-fat diet; PN, post-natal. *p < 0.05.

