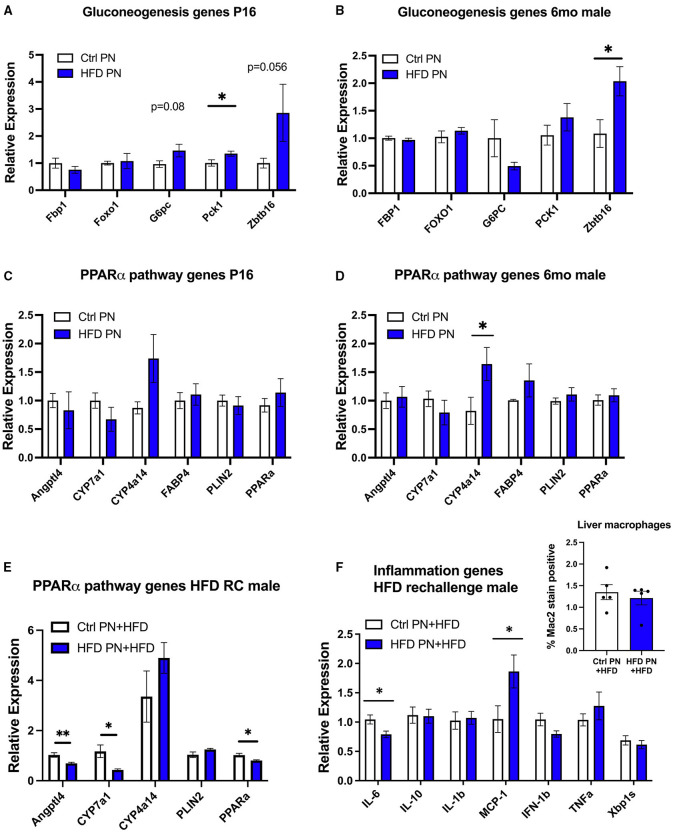
Figure 5.
Offspring hepatic gene expression across the lifespan. Gene expression data are representative of individual mice and not averaged per litter. White values are for Ctrl PN, and blue are for HFD PN offspring. Gluconeogenesis genes at post-natal day 16 (P16) Ctrl PN n = 9–10, HFD PN n = 4–7 per gene (A) and in adult male offspring maintained on ND at 6-month Ctrl PN n = 4–5, HFD PN = 4–5 per gene (B). PPAR-alpha pathway genes at P16 Ctrl PN n = 9–12, HFD PN n = 10–13 per gene (C), and in adult male offspring maintained on ND at 6-month Ctrl PN n = 7–8, HFD PN n = 7–9 per gene (D,E). PPAR-alpha pathway genes in male offspring rechallenged with HFD at 6-months Ctrl PN + HFD n = 8, HFD PN + HFD n = 8 per gene (F). Inflammatory genes in male offspring rechallenged with HFD at 6-months Ctrl PN + HFD n = 6–8, HFD PN + HFD n = 8 per gene with quantitation of liver macrophages in HFD rechallenged males at 6 months using immunofluorescent staining for Mac2 (inset). Ctrl, control; HFD, high-fat diet; PN, post-natal. *p < 0.05, **p < 0.01.

